SIG Instrumentation Introduction... Damien Grisonnet, Pranshu Srivastava, Yongrui Lin & Richa Banker
Damien Grisonnet, Pranshu Srivastava, Yongrui Lin, Richa Banker
KubeCon + CloudNativeCon Europe 2025 · Session
Overview
Operating and debugging complex distributed systems like Kubernetes at scale demands robust observability. The Kubernetes Special Interest Group (SIG) Instrumentation is at the forefront of providing the foundational tools and best practices to achieve this, focusing on the four pillars of observability: metrics, traces, logs, and events. This talk, presented by key contributors from Red Hat and Google, offers an in-depth look into the SIG's charter, recent advancements, and future roadmap, highlighting how these efforts empower component owners and end-users to gain unprecedented visibility into their clusters.
Key moments
- 0:00 Introduction to SIG Instrumentation and agenda
- 0:45 SIG Instrumentation's purpose and sub-projects
- 2:10 Overview of Prometheus metrics in Kubernetes
- 2:55 Warning: Renaming metrics is a breaking change
- 3:30 Kubernetes metrics framework and stability levels
- 4:45 Useful metrics for debugging Kubernetes clusters
- 6:50 Introducing Z-pages for Kubernetes debugging
- 7:45 Z-pages now available in all control plane components
SIG Instrumentation Introduction... Damien Grisonnet, Pranshu Srivastava, Yongrui Lin & Richa Banker
Speakers: Damien Grisonnet, Code TL, Red Hat; Pranshu Srivastava, Red Hat; Yongrui Lin, Google; Richa Banker, Software Engineer, Google
Conference: KubeCon EU
YouTube: https://www.youtube.com/watch?v=RwcC44BWDvA
Overview
Operating and debugging complex distributed systems like Kubernetes at scale demands robust observability. The Kubernetes Special Interest Group (SIG) Instrumentation is at the forefront of providing the foundational tools and best practices to achieve this, focusing on the four pillars of observability: metrics, traces, logs, and events. This talk, presented by key contributors from Red Hat and Google, offers an in-depth look into the SIG's charter, recent advancements, and future roadmap, highlighting how these efforts empower component owners and end-users to gain unprecedented visibility into their clusters.
The speakers, Pranshu Srivastava, Richa Banker, Damien Grisonnet, and Yongrui Lin, collectively bring significant experience from both Red Hat and Google, with years of dedicated involvement in SIG Instrumentation. They elaborate on the evolution of Kubernetes' instrumentation stack, from standardizing Prometheus metrics and enhancing logging capabilities to integrating distributed tracing and developing advanced sub-projects for resource state monitoring. The session underscores the SIG's commitment to improving the overall Kubernetes cluster experience by providing stable, actionable, and comprehensive signals that are crucial for efficient debugging, performance optimization, and proactive anomaly detection.
This article delves into the technical intricacies discussed, exploring the Kubernetes Metrics Framework, the introduction of Z pages for component introspection, the shift towards structured and contextual logging, and the integration of distributed tracing with existing signals. Furthermore, it examines the critical sub-projects like Usage Metrics Collector (UMC) and the evolution from Kube State Metrics (KSM) to the more flexible Resource State Metrics (RSM), demonstrating the continuous innovation driven by SIG Instrumentation to meet the evolving demands of the Kubernetes ecosystem.
Background
▶ Watch: Introduction to SIG Instrumentation and agenda (0:00)
The inherent complexity of Kubernetes, with its myriad of interconnected microservices and components, presents a significant challenge for operators and developers alike. When a request traverses multiple components—from the API server to the scheduler, controller manager, and Kubelet—identifying the root cause of latency or failure can be arduous. Traditional debugging often involves sifting through disparate logs and basic metrics, a process that is both time-consuming and prone to misinterpretation, especially in large-scale, dynamic environments.
Historically, Kubernetes leveraged Prometheus for metrics collection, with components exposing data via standard HTTP endpoints. However, the lack of a formalized framework around metric stability often led to breaking changes when metrics were renamed or altered, disrupting existing monitoring setups and dashboards. Similarly, logging relied on Klog, a fork of the Google logger, which, while functional, primarily produced unstructured, string-based log lines. This made automated parsing, querying, and correlation across components exceedingly difficult, requiring cumbersome grep and regex operations.
Recognizing these challenges, SIG Instrumentation was formed to establish best practices and provide centralized tooling, primarily through the component-base library, to standardize how Kubernetes components instrument themselves. The goal was to move beyond rudimentary signals and embrace a holistic observability strategy that integrates metrics, traces, logs, and events in a coherent and actionable manner. This ongoing effort aims to simplify debugging, improve operational efficiency, and ultimately enhance the reliability and performance of Kubernetes clusters by making internal states and behaviors transparent.
Key Findings
▶ Watch: Overview of Prometheus metrics in Kubernetes (2:10)
The talk highlighted several critical advancements and ongoing initiatives within SIG Instrumentation, addressing long-standing challenges in Kubernetes observability:
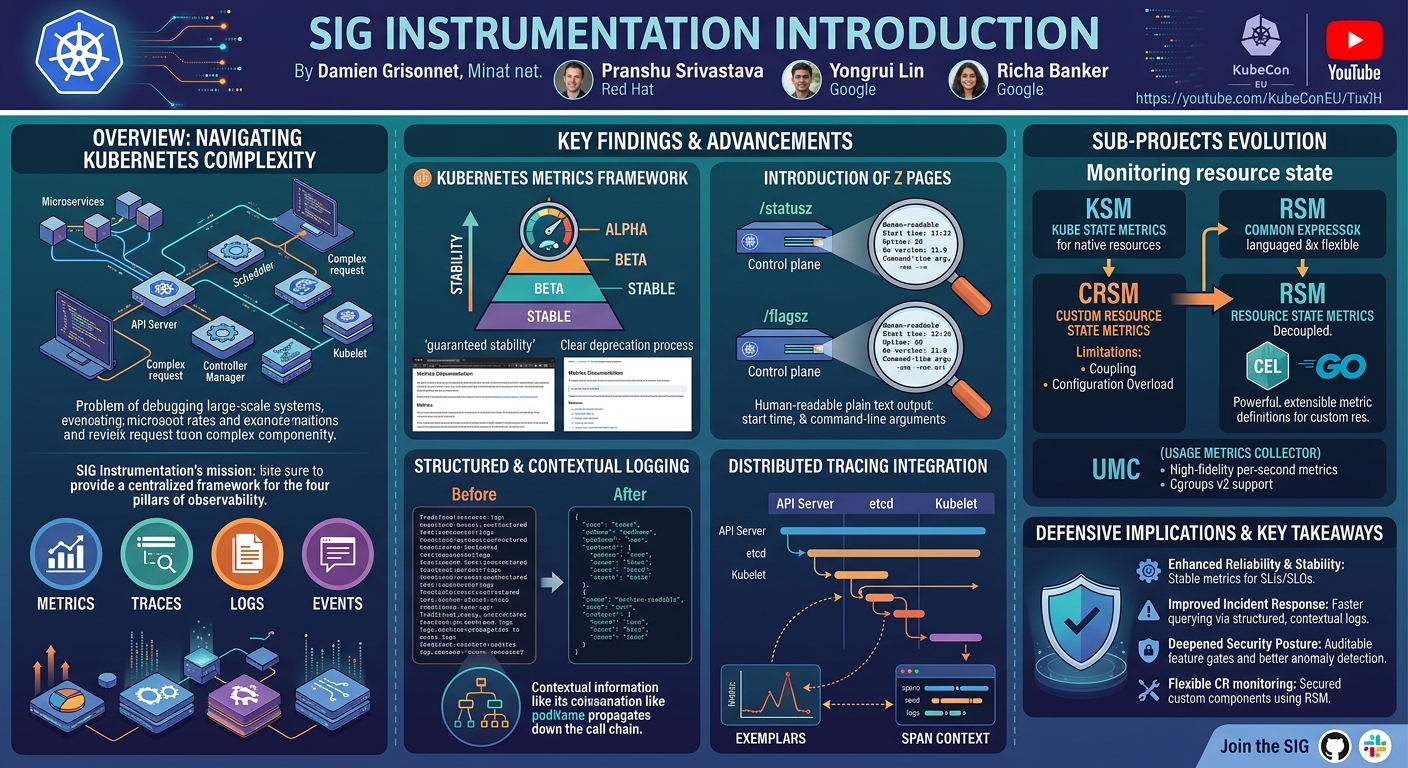
- Kubernetes Metrics Framework: To combat the issue of unstable metrics, a formalized framework was introduced. This framework wraps Prometheus client libraries, adding annotations to denote stability levels (Alpha, Beta, Stable) and establishing a clear deprecation process. This provides guarantees about metric stability, allowing users to build reliable monitoring and alerting systems without fear of unexpected breakage.
- Introduction of Z Pages: A novel set of HTTP endpoints, dubbed Z pages, was introduced to offer human-readable insights into component binaries. Initially
statusandflagsZ pages were exposed by thekube-apiserverin Kubernetes 1.32, providing details like start time, Go version, and command-line arguments. These were expanded to all control plane components in 1.33, significantly simplifying on-the-spot debugging. - Structured and Contextual Logging: Klog, the custom logger, evolved to support structured logging, enabling output in a machine-readable JSON format. This dramatically improves log analysis and queryability. Further, contextual logging was introduced to propagate context (e.g., pod name) down the call chain, ensuring consistent and correlatable log lines across different code paths.
- Distributed Tracing Integration: Tracing, the newest signal, was integrated into the API server and Kubelet, becoming beta in Kubernetes 1.27 with a target for GA in 1.34. This provides end-to-end visibility into request flows, breaking down latency across components like
etcdor container runtimes. Crucially, efforts are underway to integrate tracing with metrics via exemplars and with logs via span context, creating a unified debugging pipeline. - Evolution of Resource State Monitoring: The sub-projects focused on monitoring Kubernetes resource states saw significant development. The Usage Metrics Collector (UMC) was highlighted for providing high-fidelity, per-second metrics for Kubelet, including Cgroups v2 support. The talk also detailed the transition from Custom Resource State Metrics (CRSM), which had scalability and coupling issues, to the new Resource State Metrics (RSM). RSM offers a decoupled, extensible solution that supports custom resolvers (e.g., CEL - Common Expression Language) and provides a Go library for Turing-complete metric definitions, addressing the limitations of its predecessor.
Technical Deep Dive
▶ Watch: Kubernetes metrics framework and stability levels (3:30)
SIG Instrumentation's work spans the entire spectrum of observability, with significant technical advancements in each signal.
Metrics
Kubernetes components follow the Prometheus metric format, exposing their data via an HTTP/metrics endpoint. Any monitoring system compatible with Prometheus can scrape these endpoints, store the data in a time-series database, and build dashboards and alerts. A critical lesson learned from past breakages was the danger of renaming metrics. To address this, the Kubernetes Metrics Framework was established. This framework wraps the Prometheus client libraries, adding an annotation for stability levels:
- Alpha: Least stable, no stability guarantees, subject to change.
- Beta: More stable, with some guarantees, but schema might still evolve.
- Stable: Most stable, with strong guarantees, minimal breaking changes.
This framework also includes automation and a centralized mechanism under component-base for instrumentation code. An elaborate deprecation process ensures that users are not abruptly impacted by metric removals, allowing time to migrate their monitoring.
Several useful metrics were highlighted:
- Feature Enablement Metric (Beta): Exposes all enabled feature gates in a component, along with their stage (alpha, beta, GA), crucial for understanding active functionalities.
- Component Health SLIs: Exposed via an
SLIsendpoint by all control plane components, these report the results of liveness and readiness checks. These low-cardinality metrics are ideal for computing availability statistics, measuring success rates for Kubernetes upgrades (especially across minor versions), and can be scraped at high frequency for granular views. - Metrics about Metrics: Provides insights into the instrumentation itself, such as the total number of registered metrics per component, broken down by stability level, deprecated version labels, disabled metrics, and hidden metrics. This self-referential instrumentation helps maintain the quality and consistency of the overall metric landscape.
All these metrics are accompanied by auto-generated documentation on the official Kubernetes docs website, providing measurement details and schema for easier debugging.
Z Pages
A recent addition to Kubernetes observability is Z pages, a set of separate HTTP endpoints for human-readable component introspection. Introduced in Kubernetes 1.32, initially for the kube-apiserver, they included:
statusz: Provides details about the component binary, such as start time, uptime, Go version, and binary/emulation versions.flagsz: Lists all command-line arguments used to start the binary, along with their values.
In Kubernetes 1.33, both statusz and flagsz became available across all control plane components (e.g., Kubelet, Scheduler), provided the ComponentStatusZ and ComponentFlagZ feature gates are enabled. These endpoints output in plain text format and are explicitly not a stable API yet, meaning their response schema is subject to change. They are intended for human readability and troubleshooting, not machine parsing, though plans exist for feature graduation to beta and stabilization. The SIG is also exploring ideas for additional Z pages.
Logs
Logging in Kubernetes has historically relied on Klog, a custom logger forked from Google's Golang logger. Klog offers integration for converting Kubernetes objects (like pods and nodes) into string representations, simplifying log line generation for developers. However, a major limitation was the exclusive support for unstructured, text-based logs, making programmatic analysis challenging.
In recent years, SIG Instrumentation has heavily invested in structured logging. This allows logs to be emitted in a machine-readable JSON format, facilitating ingestion into logging platforms and enabling advanced querying using languages like LogQL, replacing cumbersome grep and regex patterns. This significantly optimizes debugging time.
Building on structured logging, contextual logging was introduced. This mechanism attaches a context.Context to different call sites, allowing developers to set contextual information (e.g., podName) that automatically propagates down the code tree. All subsequent log lines within that context will consistently include the podName, improving traceability and correlation across distributed operations. Structured logging is not yet GA, and the SIG actively encourages contributions, especially through the bi-weekly working group on structured logging.
Tracing
Tracing is the newest addition to Kubernetes' observability signals, addressing the challenge of understanding distributed system behavior. It provides a tree-like overview of a request's lifecycle across multiple microservices. In Kubernetes, tracing helps pinpoint latency sources within complex interactions, such as an API server request spending time in the API server itself or in the etcd storage backend.
Tracing was introduced in two core components: the API server and Kubelet, reaching beta status in Kubernetes 1.27, with a GA target for 1.34. For the API server, traces reveal time spent in different areas (serialization, compute) and interactions with etcd. For Kubelet, tracing illuminates the intricate steps of pod creation, including image pulling, sandbox creation, and interactions with the container runtime.
A key goal is to integrate tracing into the general debugging pipeline. This involves correlating traces with metrics using exemplars—samples of traces attached to specific data points in metrics graphs. For example, an exemplar could link a high-latency metric spike to the exact trace responsible for a 50-millisecond request. Furthermore, the aim is to correlate traces with logs by sharing span context in structured log lines, allowing users to jump directly from a trace UI to relevant logs for deeper investigation. While exemplars were introduced to some API server metrics in 1.32, integrating span context with structured logging is still in progress, with performance overhead being investigated.
Sub-Projects
SIG Instrumentation maintains several crucial sub-projects:
- Usage Metrics Collector (UMC): This collector addresses a gap in Kubelet's metrics, enabling high-fidelity, per-second metrics (granularity less than 15 seconds), which are essential for real-time dashboards and active autoscaling solutions (e.g., Prometheus Adapter, KEDA). UMC does not export the metrics it operates on, saving backend storage and compute by performing aggregation at collection time, eliminating the need for complex PromQL queries. A notable recent development is the addition of Cgroups v2 support, providing more granular memory feedback and swap controls, leveraging features in modern Linux distributions and container runtimes.
- Kube State Metrics (KSM): The "bread and butter" of the SIG, KSM is the most popular sub-project and the standard for generating metrics about native Kubernetes resources (e.g., Pods, Nodes, Deployments). It operates by monitoring the API server and updating metrics in real-time. KSM metrics have strong stability guarantees.
- Custom Resource State Metrics (CRSM): Introduced to extend KSM's capabilities to custom resources (CRs). Users could define collectors as configuration in YAML files, avoiding the need to write custom code. However, CRSM faced limitations: its zero-dependency, hashmap-based implementation conflicted with adding new behaviors or fields, hindering scalability. More critically, CRSM was tightly coupled with KSM, meaning a bug in CRSM could potentially affect the stability guarantees of KSM. The configuration also became overly involved over time.
- Resource State Metrics (RSM): The successor to CRSM, currently very close to alpha graduation. RSM fundamentally decouples from KSM, allowing both to run concurrently for a complete metrics solution covering both native and custom resources. RSM's configuration is a superset of CRSM's, ensuring 100% conformance for existing CRSM configurations. The key innovation in RSM is its concept of extensible resolvers. Instead of an abstract Domain Specific Language (DSL), users can leverage widely adopted expression languages. Currently, there is support for CEL (Common Expression Language), allowing users to define label values and metric values using CEL expressions. The architecture is designed to support future expression languages. For scenarios where expression languages prove Turing-incomplete or when immediate unblocking is required, RSM also allows users to implement the collectors interface as a Go library, providing a Turing-complete way to define metrics. Unlike KSM, RSM metrics do not carry stability guarantees, reflecting their custom nature.
Demo / Proof of Concept
▶ Watch: Useful metrics for debugging Kubernetes clusters (4:45)
While the talk did not feature a live, interactive demonstration, the speakers effectively used illustrative examples and screenshots throughout their presentation to serve as proofs of concept for the discussed features and their practical applications. These visual aids demonstrated how the new instrumentation capabilities manifest in real-world Kubernetes environments.
For metrics, the speakers presented the standard Prometheus architecture diagram, showing how Kubernetes components expose metrics and how monitoring systems scrape them. They highlighted the structure of useful metrics like feature_gates and component_health_slis, displaying their output format and explaining their utility for debugging and availability tracking. The auto-generated documentation for metrics was also showcased, providing a clear example of how users can quickly look up metric schemas.
The utility of Z pages was demonstrated with screenshots of statusz and flagsz output from a Kubernetes component. These images clearly showed the human-readable plain text format, illustrating the detailed binary information and command-line arguments available for immediate inspection.
For structured logging, the presentation provided a compelling side-by-side comparison of traditional unstructured Klog output versus the new JSON-formatted structured logs. This visual contrast powerfully conveyed the improvement in readability and machine-parsability, emphasizing how much easier it is to query and analyze the structured format. The concept of contextual logging was explained through examples of how context like a pod name would consistently appear in log lines down a call tree.
Distributed tracing was visually explained with diagrams showing a trace waterfall for an API server request, detailing spans for time spent in the API server and etcd. Another diagram illustrated a Kubelet trace during pod creation, breaking down steps like image pull and sandbox creation. The integration of traces with metrics was demonstrated with a graph showing exemplars—dots on the metric curve that link to specific trace IDs, allowing users to drill down from a metric anomaly to the exact trace.
Finally, for the sub-projects, the talk included examples of CRSM configuration and the resulting metrics, showcasing the YAML-based definition. The advancements in RSM were demonstrated with a configuration example illustrating the use of CEL (Common Expression Language) as an extensible resolver for defining metric labels and values, providing a concrete example of the new, flexible approach to custom resource monitoring. These visual examples served to concretely illustrate the impact and functionality of each technical development.
Defensive Implications
▶ Watch: Z-pages now available in all control plane components (7:45)
The advancements in Kubernetes SIG Instrumentation significantly bolster the defensive posture and operational resilience of Kubernetes clusters. By providing more comprehensive, stable, and correlatable observability signals, defenders can enhance their capabilities across several key areas:
- Enhanced Reliability and Stability: The Kubernetes Metrics Framework with its stability levels and deprecation process is crucial for building resilient monitoring and alerting systems. Defenders can rely on stable metrics for Service Level Indicators (SLIs) and Service Level Objectives (SLOs), ensuring that critical alerts and dashboards remain functional across Kubernetes upgrades. The Component Health SLIs directly provide availability stats, enabling proactive identification and mitigation of component failures that could impact cluster stability or application uptime.
- Improved Troubleshooting and Incident Response: The shift to structured and contextual logging dramatically improves the efficiency of log analysis. Machine-readable JSON logs are easier to ingest into Security Information and Event Management (SIEM) systems and log aggregation platforms, enabling faster querying and correlation during security incidents or operational outages. Contextual logging ensures that critical information, such as
podNameorrequestID, is consistently present across log lines, simplifying the reconstruction of event sequences and pinpointing the source of issues. - Deepened Security Posture and Auditability: The feature enablement metrics provide visibility into which feature gates are active. This is invaluable for security auditors and compliance teams to verify that expected security features are enabled or disabled according to policy. Robust observability, in general, enhances the ability to detect anomalous behavior, potential intrusions, or misconfigurations by providing a clear baseline of normal operations and quick identification of deviations.
- Proactive Performance Optimization and Resource Management: Distributed tracing offers end-to-end visibility into request flows, allowing defenders to identify performance bottlenecks or unexpected interactions between microservices. This can indirectly contribute to security by preventing resource exhaustion attacks (e.g., DoS) through optimization. Correlating traces with metrics (via exemplars) and logs provides a powerful investigative tool for understanding the full context of performance degradations or failures. The Usage Metrics Collector (UMC), with its high-fidelity metrics and Cgroups v2 support, enables more granular resource monitoring, crucial for detecting resource abuse or unexpected consumption patterns.
- Comprehensive Custom Resource Monitoring: The Resource State Metrics (RSM) sub-project is vital for securing and operating Kubernetes environments that heavily rely on custom resources. By providing a flexible and extensible way to monitor CRs, defenders can gain critical insights into the health, status, and configuration of these custom components. This is essential for identifying potential misconfigurations, unauthorized changes, or vulnerabilities introduced by custom controllers and resources, which might otherwise be blind spots. The decoupling of RSM from KSM also ensures that monitoring custom resources does not jeopardize the stability guarantees of native Kubernetes resource monitoring.
Key Takeaways
- Unified Observability Framework: Kubernetes SIG Instrumentation is committed to providing a comprehensive framework for metrics, logs, traces, and events, which are essential for effective debugging and operation of complex Kubernetes clusters.
- Stable and Reliable Metrics: The Kubernetes Metrics Framework introduces vital stability levels (Alpha, Beta, Stable) and a formal deprecation process, ensuring that monitoring and alerting systems remain resilient and functional across Kubernetes versions.
- Enhanced Log Analysis: The adoption of structured logging in Klog, supporting machine-readable JSON output, combined with contextual logging, significantly improves the queryability, correlation, and overall efficiency of log analysis for faster incident response.
- End-to-End Request Visibility: Distributed tracing is being integrated into core components (API server, Kubelet) and correlated with metrics via exemplars and with logs via span context, offering unparalleled end-to-end visibility into request lifecycles.
- Flexible Custom Resource Monitoring: The new Resource State Metrics (RSM) sub-project offers a decoupled, highly extensible solution for monitoring both native and custom Kubernetes resources, supporting advanced expression languages like CEL and providing a Golang library for Turing-complete metric definitions.
- Community Contribution Welcome: SIG Instrumentation actively encourages new contributors, offering a relatively accessible entry point into Kubernetes development, particularly in areas like structured logging, and provides clear pathways for involvement.
About the Speaker(s)
The presentation was delivered by a team of experienced contributors from both Red Hat and Google, deeply involved in the Kubernetes SIG Instrumentation.
Pranshu Srivastava is associated with Red Hat and has been actively involved with the SIG Instrumentation for approximately three years, contributing to various aspects of Kubernetes observability.
Richa Banker is a Software Engineer at Google and has been a member of the SIG Instrumentation for about two years, contributing her expertise to the group's initiatives.
Damien Grisonnet works for Red Hat and serves as a Code TL (Technical Lead) for SIG Instrumentation, a role he has held for about three years, guiding the technical direction of the SIG's projects.
Yongrui Lin is also with Google and recently became a new member of the Kubernetes community, sharing his personal journey of contributing to Kubernetes starting through the SIG Instrumentation, highlighting the group's welcoming environment for new contributors.
Reviews
Dr. Zero (Offensive Security Researcher) — STRONG ACCEPT
This talk from SIG Instrumentation contributors provided a deep, no-nonsense update on the current state and future roadmap of Kubernetes observability. It covered critical advancements in metrics stability, structured logging, distributed tracing integration, and the evolution of resource state monitoring, offering concrete, actionable insights for anyone operating or developing on Kubernetes. The focus on practical improvements and the technical details presented make this a valuable session for the target audience.
Heather Calloway (CISO) — STRONG ACCEPT
This KubeCon talk on SIG Instrumentation provides critical insights into the foundational observability capabilities of Kubernetes. While deeply technical, it outlines advancements in metrics, logging, and tracing that directly enhance operational resilience, incident response, and regulatory compliance for organizations relying on Kubernetes. The work presented is essential for any CISO seeking to mature their platform security and ensure accountability within complex, distributed environments.