Enhancing Database Observability With OpenTelemetry - Marylia Gutierrez, Grafana Labs
Marylia Gutierrez, Grafana Labs
KubeCon + CloudNativeCon Europe 2025 · Session
Overview
In this insightful KubeCon EU talk, Marylia Gutierrez, a Staff Software Engineer at Grafana Labs, delves into the critical area of database observability and how it can be significantly enhanced using OpenTelemetry. Gutierrez, a maintainer for OpenTelemetry's contributor experience, JavaScript SDK, and crucially, its database semantic conventions, highlights the journey and recent advancements in standardizing how database interactions are observed across diverse systems. The talk emphasizes the importance of consistent data collection for effective troubleshooting, performance optimization, and informed decision-making regarding database infrastructure.
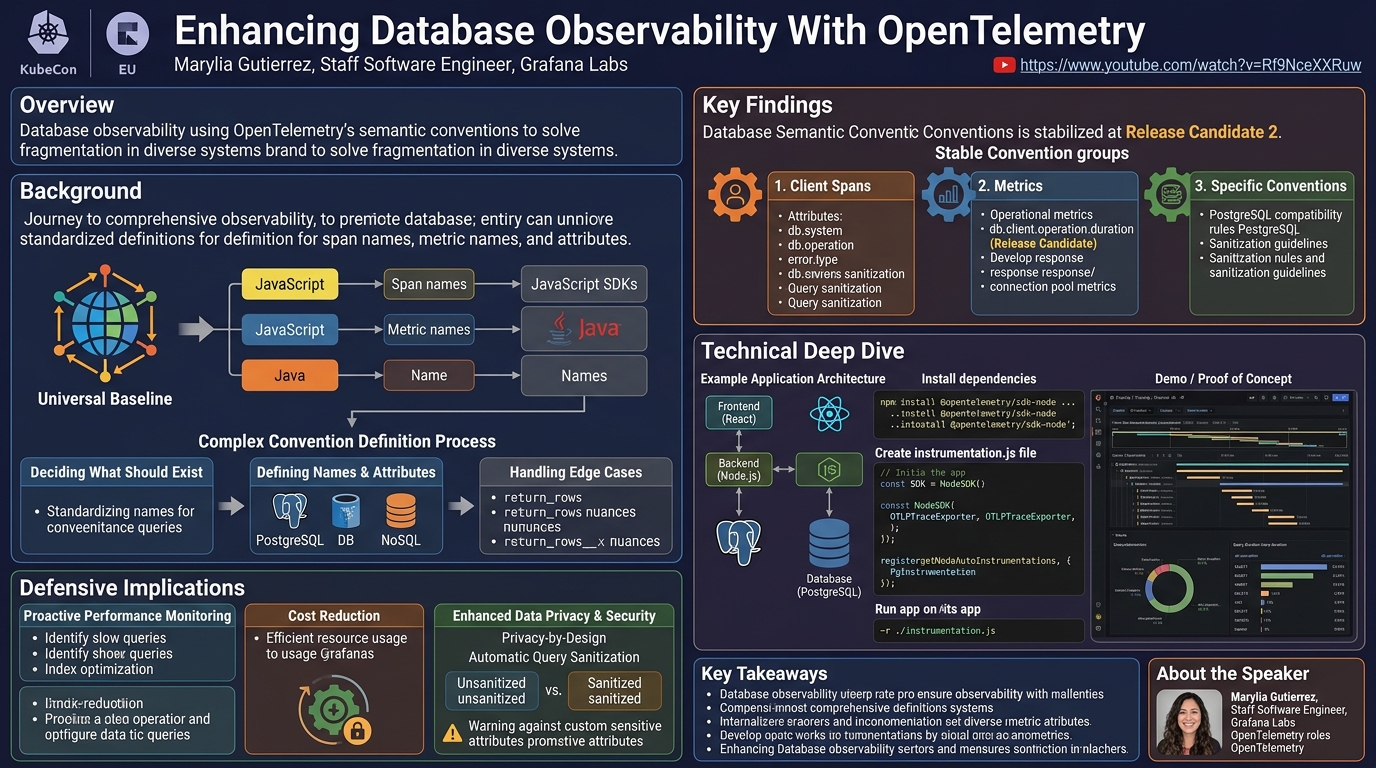
Key moments
- 0:00 Introduction and speaker's OpenTelemetry contributions
- 1:00 What are OpenTelemetry semantic conventions and why they matter
- 2:30 Challenges and complexities in defining universal conventions
- 4:40 Announcing database semantic conventions are becoming stable
- 5:00 Overview of database semantic convention groups: spans, metrics, specific
- 6:30 Detailed attributes defined for database operation spans and metrics
- 7:00 Setting up the practical application example for instrumentation
Enhancing Database Observability With OpenTelemetry
Speakers: Marylia Gutierrez, Staff Software Engineer, Grafana Labs
Conference: KubeCon EU
YouTube: https://www.youtube.com/watch?v=Rf9NceXXRuw
Overview
In this insightful KubeCon EU talk, Marylia Gutierrez, a Staff Software Engineer at Grafana Labs, delves into the critical area of database observability and how it can be significantly enhanced using OpenTelemetry. Gutierrez, a maintainer for OpenTelemetry's contributor experience, JavaScript SDK, and crucially, its database semantic conventions, highlights the journey and recent advancements in standardizing how database interactions are observed across diverse systems. The talk emphasizes the importance of consistent data collection for effective troubleshooting, performance optimization, and informed decision-making regarding database infrastructure.
The core problem OpenTelemetry aims to solve in this context is the fragmentation and inconsistency in how different applications and languages report database-related metrics and traces. Without a unified standard, combining and analyzing observability data from various sources becomes a complex, often impossible, task. Gutierrez presents OpenTelemetry's semantic conventions as the solution, providing a common language and structure for capturing database operations, connection pools, and response times.
This talk is particularly relevant for developers, SREs, and platform engineers grappling with database performance issues, seeking to gain deeper insights into their data layer, or looking to adopt modern observability practices. By standardizing database telemetry, OpenTelemetry empowers organizations to build more resilient, performant, and cost-effective applications, making it a foundational element for robust system health monitoring.
Background
▶ Watch: Introduction and speaker's OpenTelemetry contributions (0:00)
The journey to comprehensive database observability with OpenTelemetry begins with semantic conventions. These are standardized definitions for common observability data, such as span names, metric names, and attributes. Their primary purpose is to ensure that when different applications, languages, or instrumentation libraries describe the same underlying concept (e.g., a database query), they use identical terminology and data structures. This standardization is crucial for several reasons.
Firstly, it establishes a universal baseline. When everyone agrees on what constitutes a "span" for a database operation or what "query time" means, engineers across different teams and technologies can communicate and collaborate more effectively. Without semantic conventions, a JavaScript SDK might define a metric as statement.duration, while a Java SDK might call it query_time. An observability vendor would then receive two distinct names for the same event, making aggregation, correlation, and analysis cumbersome, if not impossible. Standardized names allow for seamless combination and comparison of data, regardless of its origin.
The creation of semantic conventions, while conceptually straightforward, is a deeply complex and time-consuming process. It involves several challenging steps:
- Deciding what should exist: This initial step, like agreeing on the need for database conventions, is generally easy.
- Defining names and attributes: This is where the complexity truly emerges. Database ecosystems are incredibly diverse, encompassing relational databases (PostgreSQL, MySQL), NoSQL databases (MongoDB, Cassandra), graph databases, and even emerging vector databases. A convention must be broad enough to apply to all, yet specific enough to be useful. For instance, while a
tableattribute might seem obvious for a relational database, it's irrelevant for many NoSQL systems. Similarly, defining anoperationattribute must account for various command types (SELECT, INSERT, UPDATE, DELETE) and database-specific actions. - Handling edge cases and nuances: Consider the
return_rowsattribute. If a query is designed to return a billion rows but the application only iterates through a few before stopping, what number should be reported? The total potential rows, or the actually consumed rows? And if the latter, does an event exist to capture that specific point of iteration cessation? These kinds of questions require extensive discussion and iteration across different language SDKs and database types, explaining why conventions often take "a year or years to define things." The goal is to create definitions that work universally, avoiding situations where a convention works for one language but not another, or for one database type but not its peers.
This rigorous, collaborative process ensures that the resulting semantic conventions are robust, comprehensive, and truly beneficial for the entire OpenTelemetry ecosystem, paving the way for consistent and powerful database observability.
Key Findings
▶ Watch: Challenges and complexities in defining universal conventions (2:30)
Marylia Gutierrez shared significant progress regarding the database semantic conventions, highlighting their impending stability. Just two days prior to the talk, the conventions were marked as Release Candidate 2, signifying that they are on track to be declared stable by the end of the month. This is a major milestone, as stability ensures that instrumentations built upon these conventions will remain consistent, reducing the risk of breaking changes for users.
The stable database conventions are structured around three main groups:
- Client Spans: These define how individual database operations, initiated by a client application, are represented as spans within a trace. Spans capture the duration, status, and contextual attributes of an operation. Key elements defined here include:
- Span Name: Standardized naming for database operations.
- Status: Indicating success or failure of the operation.
- Common Attributes: A set of 15 attributes designed to describe database interactions. These include
db.system(e.g.,postgresql),db.name,db.connection_string,db.statement,db.operation,db.user,db.table, anderror.type. It's important to note that many of these are recommended rather than required, allowing flexibility for databases that might not possess certain concepts (e.g.,db.tablefor NoSQL databases). Thedb.statementattribute also includes crucial guidelines on sanitization to protect sensitive data. - Query Summary Generation: Instructions on how to create a summary of the query for easier analysis without exposing full sensitive data.
- Metrics: These focus on quantitative measurements related to database performance. While the client spans are largely stable, the metrics conventions are currently in a mixed state.
- Database Operation Metrics: This category, including metrics like
db.client.operation.duration(tracking how long operations take), is also a Release Candidate. - Database Response Metrics: Currently under development, these will likely capture details about the outcomes of operations (e.g.,
db.client.response.rows_returned). - Connection Pool Metrics: Also under development, these will provide insights into connection pool usage, such as
db.client.connections.usageordb.client.connections.idle.count. These are newer additions reflecting the growing need for granular insights into connection management. - Attributes for database operation metrics are also defined, enabling breakdowns by
db.system,db.operation, and other relevant dimensions.
- Specific Conventions: This group addresses particularities that don't fit neatly into spans or general metrics.
- Database Compatibility: For instance, it specifies that databases compatible with PostgreSQL should simply use
postgresqlas theirdb.systemname, avoiding the proliferation of similar but distinct names. - Sanitization Rules: Detailed guidelines on how to sanitize query strings to prevent the accidental exposure of sensitive data, a paramount concern for observability.
- Units and Aggregation: Definitions for units of measurement for metrics and how data should be grouped or summarized (e.g., for query summaries).
The stabilization of these conventions marks a significant leap forward, providing a robust framework for consistent and high-quality database observability across the OpenTelemetry ecosystem.
Technical Deep Dive
▶ Watch: Overview of database semantic convention groups: spans, metrics, specific (5:00)
To illustrate the practical application of OpenTelemetry's database semantic conventions, Marylia Gutierrez walked through a compelling example involving a simple web application. The setup consisted of a React frontend, a Node.js backend, and a PostgreSQL database. The focus of the demonstration was instrumenting the Node.js backend to capture database interactions.
Example Application Architecture
The demonstration application is straightforward:
- Frontend: A basic React application that lists users, with options to refresh the list, add new users, and remove existing ones.
- Backend: A Node.js application, which is the target for instrumentation. It exposes API endpoints for the frontend.
- Database: A PostgreSQL instance, handling user data.
The backend code comprises two main logical parts:
- Database Interaction Layer:
- A
connectfunction establishes the database connection. get_user: Performs aSELECToperation to retrieve user data.add_user: Executes anINSERToperation to add a new user.remove_user: HandlesDELETEoperations to remove users.
These functions encapsulate the direct database calls.
- API Routes:
- A
GETendpoint/usersthat calls theget_userfunction. - Two
POSTendpoints, one for adding (/users) and one for removing (/users/:id), which invokeadd_userandremove_userrespectively.
This structure is typical for many web applications, making it an ideal candidate for demonstrating real-world instrumentation.
Instrumentation Process
Instrumenting the Node.js backend with OpenTelemetry involves a few key steps:
- Install Dependencies:
The first step is to add the necessary OpenTelemetry packages. For this Node.js example, the following were installed:
@opentelemetry/sdk-node: The core Node.js SDK.@opentelemetry/auto-instrumentation-node: A powerful package that provides automatic instrumentation for many popular Node.js libraries and frameworks, simplifying the setup process significantly.@opentelemetry/instrumentation-pg: The specific instrumentation library for PostgreSQL, which is the database used in the example. This library implements the database semantic conventions for PostgreSQL.
- Create Instrumentation File (
instrumentation.js):
A dedicated file is created to configure and initialize the OpenTelemetry SDK. This file typically includes:
- Imports: Necessary components from the OpenTelemetry SDK.
- SDK Initialization: The
NodeSDKis initialized. For demonstration purposes, aConsoleSpanExportercan be used to print traces to the terminal, allowing developers to quickly verify what data is being collected. For sending data to an observability backend like Grafana, anOTLPTraceExporter(OpenTelemetry Protocol Trace Exporter) is used. - Instrumentation Registration: The
getNodeAutoInstrumentations()function is called to register all available automatic instrumentations. Crucially, thePgInstrumentationis also registered here, ensuring that PostgreSQL calls are properly captured.
- Set Environment Variables:
To direct the collected telemetry data to the chosen observability backend, several environment variables are configured:
OTEL_EXPORTER_OTLP_PROTOCOL: Specifies the communication protocol (e.g.,http/protobuf).OTEL_EXPORTER_OTLP_ENDPOINT: The URL of the OpenTelemetry Collector or the observability vendor's ingestion endpoint (e.g., Grafana's OTLP endpoint).OTEL_EXPORTER_OTLP_HEADERS: Often used for authentication tokens (e.g.,Basic <your_token>).OTEL_SERVICE_NAME: A highly recommended variable, setting a logical name for the service (e.g.,my-node-backend). This is crucial for filtering and organizing data in the observability platform, especially in microservices architectures.
- Run the Application:
Instead of directly running node index.js, the application is launched by requiring the instrumentation file first:
node -r ./instrumentation.js index.js
This ensures that the OpenTelemetry SDK is initialized and active before the application's main code begins execution.
Demo / Proof of Concept
After setting up the instrumentation and running the application, Gutierrez demonstrated the results in an observability vendor's UI (Grafana in this case).
- Interacting with the UI: The speaker interacted with the frontend application, performing actions like refreshing the user list, adding new users (e.g., "awesome women in science"), and removing others. These actions generated database calls, which in turn produced traces and metrics.
- Viewing Traces:
- In the observability UI, filtering by the
service.name(my-node-backend) quickly brings up relevant data. - Clicking on a trace for a
get_usersoperation reveals a breakdown of its constituent spans. For instance, aget_userstrace would show spans for: - The incoming HTTP request to the backend.
- An internal span for the
get_userfunction. - Crucially, database spans for
connect(representing the connection pool establishment) and theSELECTquery itself. - Clicking on a database span (e.g., the
SELECToperation) displays its attributes. These attributes strictly adhere to the OpenTelemetry database semantic conventions, providing rich context: db.system:postgresqldb.name: The database name.db.connection_string: The connection string (potentially sanitized).db.statement: The actual SQL query, which is sanitized by default to remove sensitive parameters (e.g.,SELECT FROM users WHERE id = ?instead ofSELECT FROM users WHERE id = 123).db.operation:SELECTnet.peer.name: The database host.net.peer.port: The database port.
It was noted that not all 15 defined attributes are always present, as many are recommended and only set if applicable to the specific operation or database.
- Viewing Metrics:
- The demo also showcased database operation duration metrics. A graph displayed the overall duration of database calls.
- The true power of semantic conventions was demonstrated by breaking down this metric using the
db.operationattribute. This allowed for separate lines on the graph forSELECT,INSERT, andDELETEoperations. - In the example,
INSERTandDELETEoperations were observed to take longer thanSELECToperations. This made sense given the small table size forSELECTs, whileINSERTandDELETEmodify the data. This kind of breakdown immediately highlights performance differences between different types of database interactions.
This demonstration effectively illustrated how OpenTelemetry, with its standardized semantic conventions, transforms raw database interactions into structured, actionable observability data, enabling deep insights into application performance.
Defensive Implications
▶ Watch: Setting up the practical application example for instrumentation (7:00)
The detailed observability provided by OpenTelemetry's database semantic conventions offers several critical defensive implications for maintaining robust, secure, and performant applications:
- Proactive Performance Monitoring and Optimization:
- Identify Slow Queries: By tracking
db.client.operation.durationand breaking it down bydb.statement(or a query summary), teams can quickly pinpoint specific slow queries impacting user experience. - Index Optimization: The ability to compare database operation durations before and after creating or modifying database indexes is invaluable. Engineers can immediately verify the efficiency of new indexes, ensuring they provide the expected performance boost.
- Database Selection and Migration: When evaluating different database technologies or considering migrating between them, OpenTelemetry allows for direct performance comparison. By running benchmarks with instrumentation on different database backends (each with a distinct
service.name), organizations can make data-driven decisions about which database offers the best performance-to-cost ratio for their specific workload. - ORM vs. Raw Queries: For applications using Object-Relational Mappers (ORMs), which sometimes generate inefficient or "monstrosity queries," OpenTelemetry provides the visibility to assess their performance. This allows teams to compare ORM-generated queries against hand-crafted ones, ensuring optimal database interaction.
- Query Refinement: Even for custom queries, developers can use the collected metrics to iterate and refine their SQL, continuously improving performance.
- Cost Reduction:
- Improved database and application performance directly translates to more efficient resource utilization. Faster queries mean less time spent on database servers, potentially reducing infrastructure costs (CPU, memory, I/O) associated with cloud provider usage. By identifying and optimizing bottlenecks, organizations can right-size their database instances and scale more effectively.
- Enhanced Data Privacy and Security (Sanitization):
- Default Privacy-by-Design: A cornerstone of OpenTelemetry's database instrumentation is its commitment to data privacy. By default, the instrumentation does not inspect or transmit the actual data stored within the database. Instead, it focuses on the actions performed (e.g., query execution, rows returned, connection times) and metadata about the operation.
- Automatic Query Sanitization: For
db.statementattributes, the OpenTelemetry SDKs implement strict sanitization rules. If a query is passed with arguments separately (e.g.,SELECT FROM users WHERE id = $1,[123]), the instrumentation will typically send the parameterless query (SELECT FROM users WHERE id = ?). If a query is interpolated directly with sensitive values, the instrumentation might not send the full query at all, prioritizing privacy over complete detail. This prevents sensitive information (like passwords, PII) from accidentally appearing in traces or logs. - User Responsibility and Warning: Gutierrez strongly cautioned against developers manually adding sensitive data (e.g.,
password: "123") as custom attributes. While the instrumentation itself is designed to be safe, users have the ability to extend attributes, and must exercise caution. - Future Opt-in for Full Queries: The OpenTelemetry community is working on configuration options that would allow users to explicitly opt-in to sending unsanitized queries. This would be a conscious decision, with the user acknowledging the risks and confirming that no sensitive data is present in the queries they choose to expose. Until then, the default remains maximum privacy.
- Security Injection Awareness (Indirect):
- During the Q&A, a question arose about detecting injections. Gutierrez clarified that the OpenTelemetry SDK itself, as an instrumentation library, is primarily focused on collecting basic telemetry (traces, metrics). It captures what query was executed (albeit sanitized) and how long it took, but it doesn't actively analyze queries for malicious patterns like SQL injection.
- However, the collected data can be a component in a broader security strategy. While the SDK doesn't prevent injections, the availability of sanitized query statements in traces could potentially feed into a Security Information and Event Management (SIEM) system or custom collector processing. A collector could be configured to perform additional analysis on the
db.statementattribute (if it were configured to send more detailed, non-sensitive versions) to identify suspicious query structures. This would be an additional layer of processing built on top of the OpenTelemetry data, rather than a feature of the SDK itself.
In summary, OpenTelemetry's database observability capabilities significantly enhance an organization's defensive posture by enabling deep performance insights, facilitating cost optimization, and rigorously safeguarding sensitive data through intelligent sanitization by default.
Key Takeaways
- Database Semantic Conventions are Stabilizing: OpenTelemetry's database semantic conventions have reached Release Candidate 2 and are expected to be marked stable soon, providing a reliable and consistent framework for database observability.
- Standardized Tracing and Metrics: The conventions define standardized spans (with 15 common attributes) and metrics (operation duration, response, connection pools) for database interactions, ensuring consistent data collection across different languages and database types.
- Deep Performance Analysis: The collected data enables powerful performance monitoring, allowing users to identify slow queries, compare the efficiency of different indexes, evaluate various database technologies or ORMs, and optimize query performance to reduce costs.
- Privacy-by-Design Sanitization: OpenTelemetry prioritizes data privacy by default, focusing on actions rather than actual data, and automatically sanitizing
db.statementattributes to prevent the exposure of sensitive information in traces and metrics. - Community Contribution is Crucial: The OpenTelemetry project actively seeks community feedback on existing implementations and contributions for instrumenting additional languages and database systems, acknowledging the vast and diverse database ecosystem.
About the Speaker(s)
Marylia Gutierrez is a Staff Software Engineer at Grafana Labs, where her work is deeply focused on OpenTelemetry. Within the OpenTelemetry project, she holds multiple significant roles: she is a maintainer for the contributor experience, ensuring that new contributors have a smooth onboarding process; an approver for the JavaScript SDK; an approver for the database semantic conventions, the very topic of this talk; and an approver for Portuguese localization. Her diverse involvement underscores her commitment to both the technical development and the community growth of OpenTelemetry.
Reviews
Dr. Zero (Offensive Security Researcher) — MUST SEE
This talk by Marylia Gutierrez is a foundational piece of technical research for anyone serious about modern database observability. It meticulously details the stabilization of OpenTelemetry's database semantic conventions, explaining the immense technical complexity involved in standardizing telemetry across diverse database ecosystems. The practical demonstration of instrumenting a Node.js application and showcasing the resulting rich, consistent traces and metrics, alongside robust privacy-by-design sanitization, makes this an indispensable guide for SREs, developers, and platform engineers. Gutierrez's role as an approver for these conventions lends unparalleled credibility…
Heather Calloway (CISO) — STRONG ACCEPT
Marylia Gutierrez's KubeCon EU talk on enhancing database observability with OpenTelemetry's stabilizing semantic conventions is a strong accept. It offers a clear, actionable path for standardizing critical database telemetry, directly impacting risk management, performance, and cost. The emphasis on privacy-by-design through automatic data sanitization is a particularly valuable outcome for any organization grappling with data governance and regulatory compliance. This work provides foundational visibility that informs executive decisions and strengthens institutional accountability.