Dashboards & Dragons: Crafting SLOs To Tame the AI Platform Cha... Alexa Griffith & Ankita Chaudhari
Alexa Griffith, Ankita Chaudhari
KubeCon + CloudNativeCon Europe 2025 · Session
Overview
In "Dashboards & Dragons: Crafting SLOs To Tame the AI Platform Chaos at Scale," Alexa Griffith and Ankita Chaudhari from Bloomberg delve into the critical role of Service Level Objectives (SLOs) in managing the inherent complexities and unique demands of modern Artificial Intelligence (AI) platforms, particularly those supporting Generative AI (Gen AI) at an enterprise scale. The talk addresses the burgeoning challenges faced by platform teams responsible for maintaining the reliability, performance, and user trust in these rapidly evolving environments.
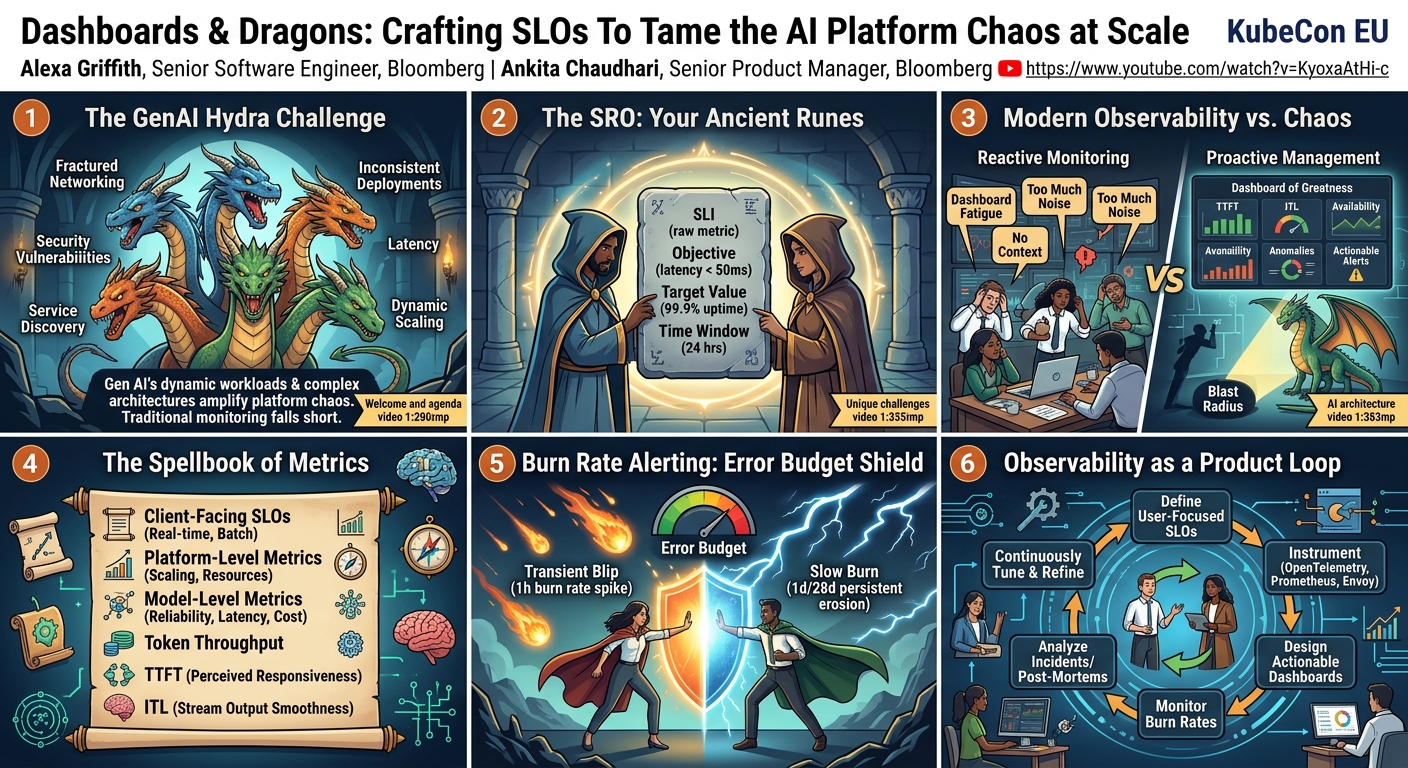
Key moments
- 0:00 Welcome and talk agenda for 'Dashboards & Dragons'
- 1:28 Understanding SLO components: SLI, objective, target, time window
- 3:10 Unique challenges and usage patterns for GenAI platforms
- 4:03 High-level GenAI platform architecture and request journey
- 5:40 Defining client, platform, and model level SLOs for GenAI
- 6:16 Essential 'spellbook' metrics for GenAI platform health
Dashboards & Dragons: Crafting SLOs To Tame the AI Platform Chaos at Scale
Speakers: Alexa Griffith, Senior Software Engineer, Bloomberg; Ankita Chaudhari, Senior Product Manager, Bloomberg
Conference: KubeCon EU
YouTube: https://www.youtube.com/watch?v=KyoxaKyoxaAtHi-c
Overview
In "Dashboards & Dragons: Crafting SLOs To Tame the AI Platform Chaos at Scale," Alexa Griffith and Ankita Chaudhari from Bloomberg delve into the critical role of Service Level Objectives (SLOs) in managing the inherent complexities and unique demands of modern Artificial Intelligence (AI) platforms, particularly those supporting Generative AI (Gen AI) at an enterprise scale. The talk addresses the burgeoning challenges faced by platform teams responsible for maintaining the reliability, performance, and user trust in these rapidly evolving environments.
The speakers articulate a comprehensive strategy for moving beyond reactive monitoring to a proactive, user-centric approach powered by well-defined SLOs and insightful observability dashboards. They highlight how traditional monitoring often falls short in the face of Gen AI's dynamic workloads, distributed architectures, and unique performance indicators. This article will explore their insights into establishing a robust observability framework that not only illuminates platform health but also guides strategic decisions and fosters continuous improvement, transforming potential chaos into controlled, reliable operation.
Background
▶ Watch: Welcome and talk agenda for 'Dashboards & Dragons' (0:00)
Bloomberg’s AI platform, like many large-scale enterprise systems, supports the entire model development lifecycle, from initial data exploration and model building to experimentation, deployment, serving, and continuous production monitoring and maintenance. This comprehensive scope necessitates a diverse array of platform teams and services, including Jupyter notebooks, High-Performance Computing (HPC) for training, managed serving, managed inference, and various AI pipelines and tools. The sheer breadth and interconnectedness of these services introduce significant complexity.
The advent and rapid adoption of Generative AI further amplify these challenges, a phenomenon the speakers aptly term the "GenAI Hydra." This metaphor illustrates how resolving one issue, such as inconsistent deployments, often leads to the emergence of new, equally pressing problems, like security vulnerabilities or observability gaps. Key complexities inherent in these platforms include fractured networking, leading to issues with latency, service discovery, and cross-cluster traffic, especially in hybrid environments that span on-premises infrastructure and public clouds like AWS Bedrock. Diverse infrastructure versions and dynamic scaling requirements further complicate management and introduce significant observability hurdles.
Traditional monitoring approaches, often characterized by an abundance of metrics without clear context, frequently lead to "dashboard fatigue." As Ankita Chaudhari points out, dashboards often fail due to "too much noise and very little signal," a lack of connection to upstream or downstream impacts, poor maintenance leading to stale metrics, and siloed views that prevent a holistic understanding of system health. Critically, observability without actionable alerts based on defined thresholds leaves platform teams in a reactive mode, often learning about issues only when users complain – by which point trust has eroded and the "blast radius" of impact has already spread. The core problem is a lack of clearly defined, real-time visibility that connects technical metrics to user experience and business impact.
Key Findings
▶ Watch: Unique challenges and usage patterns for GenAI platforms (3:10)
The talk established several critical findings for effectively managing AI platforms, particularly in the Gen AI era:
- SLOs as Foundational Language: Service Level Objectives (SLOs) serve as "ancient runes," providing a common, user-focused language that bridges the gap between engineers, operations, and stakeholders. They are essential for highlighting real user impact, prioritizing improvements, and guiding trade-offs between reliability, innovation, and velocity.
- Gen AI's Unique Observability Needs: Gen AI platforms exhibit distinct usage patterns (real-time inference, interactive workloads, batch processing) and require specialized metrics. Beyond traditional requests per second, critical indicators include token throughput, Time to First Token (TTFT), Inter Token Latency (ITL), and availability, which directly correlate with user experience in conversational and streaming AI applications.
- Modern Observability for Proactive Management: Effective observability transcends mere dashboards and alerts. It's about empowering teams to detect anomalies early, respond effectively, and proactively contain the blast radius of issues. This necessitates a shift from reactive problem-solving to a proactive stance that maintains confidence in system health.
- Principles of Great Dashboards: Dashboards must be designed for "at-a-glance clarity," instantly conveying health status and pointing to potential problem areas. They require high cardinality to slice and dice complex data, balance aggregated global views with drill-down capabilities, and be supplemented with contextual data like traces and logs to tell the full story behind metrics. Most importantly, they must provide actionable insights that drive decisions and prioritize alerts.
- Burn Rate Alerting for Error Budget Management: A pivotal finding is the power of burn rate-based alerting. This method tracks how quickly a service is consuming its predefined error budget, allowing teams to distinguish between transient blips and persistent degradation. By monitoring burn rates across multiple time windows (e.g., 1 hour, 1 day, 7 days, 28 days), platform teams can tailor responses to the severity and nature of the issue, preventing "slow burns" from eroding long-term reliability unnoticed.
- Observability as a Product: The most resilient platforms treat observability not as a static toolset but as an evolving product. This involves a continuous feedback loop driven by incidents, data analysis, and user input, ensuring that the observability stack refines and improves alongside the platform it monitors.
Technical Deep Dive
▶ Watch: High-level GenAI platform architecture and request journey (4:03)
At the core of managing AI platform reliability are Service Level Objectives (SLOs), which are carefully constructed from several components. A Service Level Indicator (SLI) is a raw metric, such as latency, throughput, or error rates, representing what is being measured. An objective defines the desired performance for that SLI (e.g., latency under 50 milliseconds). A target value specifies how often this objective must be met (e.g., 99.999% of the time). Finally, a time window defines the duration over which the target value is measured (e.g., over 24 hours). This structured approach provides a clear, quantitative definition of "good" service.
A typical Gen AI platform architecture, as described, often involves a load balancer fronting a gateway (e.g., Envoy Gateway). This gateway serves multiple purposes: routing requests to on-premises managed inference clusters (often leveraging Kubernetes with KServe) or directing traffic to external Large Language Model (LLM) providers (like AWS Bedrock). The request quest, as illustrated, is fraught with potential latency and failure points: a request hits the gateway, potentially undergoing authorization and rate limiting, before being routed to the model provider. If self-hosted, this involves prefill and decode steps before the response returns to the client. Each hop in this journey is a point for monitoring.
To measure success, Bloomberg employs a multi-tiered metric strategy:
- Client-Facing SLOs: These define the quality of service for end-users, categorized by priority (high for real-time, medium for internal real-time, low for batch inference). These are crucial for defining Service Level Agreements (SLAs).
- Platform-Level Metrics: These track infrastructure health across environments, guiding scaling and resource planning.
- Model-Level Metrics: These assess the performance of both self-hosted and vendor models, focusing on reliability, latency, and cost efficiency.
The "spellbook of metrics" for Gen AI platforms is specialized. Reliability metrics include uptime of the routing layer and API conversion errors. Cost-effectiveness is measured by optimizations like automatic routing, model caching, and prompt optimizations. Scalability metrics go beyond traditional requests, incorporating number of tokens and Time to First Token (TTFT). Finally, latency is meticulously measured across every platform component and the entire request quest.
Modern platform observability, as emphasized, is about staying ahead of problems. This requires robust observability tools capable of detecting anomalies, responding effectively, and containing the blast radius of issues. The speakers advocate for building SLO dashboards that are:
- Clear at a glance: Instantly answer "is everything healthy?"
- High cardinality: Capable of slicing and dicing data across many dimensions without overwhelming the user.
- Balanced: Offering both aggregated global views and drill-down capabilities into specific services, error patterns, or time ranges.
- Contextual: Supplemented with traces and logs to provide the "where, what, and why" behind metrics.
- Actionable: Driving decisions through clear thresholds and meaningful alerts.
A critical technical distinction for LLM performance involves two latency metrics:
- Time to First Token (TTFT): The duration from prompt submission to the model's return of the very first token. This is crucial for perceived responsiveness and the user's initial impression in conversational interfaces.
- Inter Token Latency (ITL): The time taken to generate each subsequent token after the first. This governs the smoothness and responsiveness of streamed output, especially for longer generations. Inconsistent or slow ITL leads to a "jerky" user experience, even if TTFT is fast.
The talk highlighted the utility of open-source tools such as OpenTelemetry for instrumentation, Prometheus for metric collection, and Envoy for gateway management, forming a robust foundation for a comprehensive observability stack.
Demo / Proof of Concept
▶ Watch: Defining client, platform, and model level SLOs for GenAI (5:40)
While the talk did not feature a traditional "demo" of a new tool or exploit, it provided a compelling "proof of concept" for effective observability by showcasing a series of meticulously designed example dashboards. These illustrative panels, though not representing live Bloomberg systems, demonstrated how to transform raw metrics into actionable insights for an LLM application.
The first example was a comprehensive 360-degree view of an LLM's performance over 48 hours, structured into key areas: success rates, burn rates, error budgets, latency, and throughput. This dashboard immediately revealed that while short-term success rates were strong, a 28-day window showed a success rate at the edge (99.9%), and long-term burn rates were exceeded, indicating a pattern of small, repeated failures rather than a single outage. Latency fluctuations, particularly in TTFT and ITL, suggested potential scaling inefficiencies or model bottlenecks, while throughput with error bars pointed to minor budget burn.
Further panels zoomed into specific aspects:
- Success Rates: Displayed temporal granularity, summarizing rates over different periods and showing clear drops correlatable with incident timelines.
- Burn Rate Comparison: This powerful demonstration contrasted a transient incident (sharp spike in 1-hour burn rate, flat longer-term windows) with a persistent issue (gradual increase across 1-day and 28-day windows), emphasizing how monitoring multiple windows helps distinguish noisy blips from structural reliability problems.
- Streaming Latency (TTFT & ITL): A dashboard specifically for these LLM-critical metrics showed TTFT hovering between 400-700ms (reasonable) but with dips and spikes, potentially due to cold starts or load imbalance. ITL was mostly low but had periodic spikes up to 1400ms, indicating possible concurrency limits or degraded transformer performance.
- Throughput (HTTP 200s): A panel showing 100% 200 OK responses was presented as a "too good to be true" scenario, prompting a check for correct error capture or filtered endpoints, underscoring that even seemingly perfect metrics can be misleading.
- Token Throughput: This LLM-specific view broke down throughput into prompts and generations. It illustrated a large spike in prompt traffic followed by a drop-off, correlating usage patterns with cost, error budget, and latency, and highlighting potential issues like short completions or inference failures.
- End-to-End Inference Performance: This dashboard provided a detailed look at response times across the predictor stack (gateway, Q proxy, model). While P50 latency was sub-millisecond at the network layer, the bulk of latency lay within inference and queueing, with spiky queueing delays suggesting intermittent pressure.
- GPU Utilization: A focused view of GPU resource demand and usage over a 7-day window revealed low and sporadic utilization, even during high request periods, indicating potential overprovisioning or inefficient job scheduling—a clear optimization opportunity.
- Distributed Trace: An example trace for an inference call visually confirmed that the "inference request" itself consumed the majority of time, identifying it as the primary bottleneck and guiding optimization efforts.
These example dashboards effectively served as a blueprint for how platform teams can visualize and understand the complex interplay of metrics to proactively manage Gen AI service health.
Defensive Implications
▶ Watch: Essential 'spellbook' metrics for GenAI platform health (6:16)
The insights presented in this talk offer crucial defensive strategies for platform teams managing AI, especially Gen AI, infrastructure. The primary implication is the absolute necessity of proactive observability grounded in well-defined SLOs. Defenders must move beyond simple monitoring and embrace an "observability as a product" mindset.
- Implement User-Focused SLOs: Start by defining what "good" looks like from the end-user's perspective. For Gen AI, this means focusing on metrics like Time to First Token (TTFT) and Inter Token Latency (ITL), as these directly impact user perception of responsiveness and quality. Prioritize SLOs based on the criticality of workloads (real-time, interactive, batch).
- Comprehensive Instrumentation: Ensure all layers of the AI platform—from the gateway (e.g., Envoy) and Kubernetes clusters (with KServe) to the model inference services and underlying GPU resources—are thoroughly instrumented. Leverage open-source tools like OpenTelemetry for consistent data collection across distributed systems.
- Design Actionable Dashboards: Invest in designing dashboards that provide "at-a-glance clarity" and are highly contextual. They should offer both aggregated views and the ability to drill down into specific services, error patterns, or time ranges, integrating traces and logs alongside metrics to provide a complete narrative of incidents. Avoid "vanity metrics" and focus on signals that drive decisions.
- Adopt Burn Rate-Based Alerting: Shift from static threshold-based alerts to burn rate-based alerting. Configure multiple burn rate thresholds for different time windows (e.g., 1 hour, 1 day, 7 days) to distinguish between transient blips, moderate issues, and slow, persistent degradation. This allows for tailored responses, preventing alert fatigue while ensuring critical issues receive immediate attention. Differentiate alerting severity for development versus production environments.
- Continuous SLO Refinement: Treat SLOs and alerting configurations as dynamic entities that require continuous tuning. Every incident, post-mortem, and SLO review is a learning opportunity. Adjust metrics, thresholds, and objectives based on real-world data and user feedback to ensure they accurately reflect system behavior and user expectations.
- Correlate Data for Faster MTTR: Emphasize the correlation of different telemetry signals—metrics, logs, and traces. This integrated view is vital for quickly identifying root causes, understanding the full impact of an issue, and significantly reducing the Mean Time To Resolution (MTTR).
- Optimize Resource Utilization: Actively monitor infrastructure utilization, particularly for high-cost resources like GPUs. Dashboards showing low or sporadic utilization, even during peak request times, signal opportunities for optimizing job scheduling, resource allocation, or scaling strategies to improve cost-effectiveness.
- Proactive Bottleneck Identification: Use detailed latency breakdowns (e.g., end-to-end inference performance, distributed traces) to identify performance bottlenecks within the inference stack (e.g., gateway, queue proxy, model processing itself). This allows platform teams to focus optimization efforts where they will have the most impact, such as reducing model latency, improving caching, or parallelizing tasks.
- Validate Metrics and Error Handling: Be wary of "too good to be true" metrics, such as 100% success rates in production. Regularly audit instrumentation to ensure errors are being accurately captured, not swallowed, misclassified, or filtered out. This vigilance ensures that the observability system is truly reflecting the full picture of system health.
By implementing these defensive strategies, platform teams can transform their AI platforms from chaotic, reactive systems into resilient, predictable, and user-trusted services.
Key Takeaways
- SLOs are Foundational for AI Platform Reliability: Service Level Objectives (SLOs) provide a crucial, common language for defining and measuring the health of complex AI platforms, especially for Generative AI, ensuring alignment between engineering, operations, and business stakeholders.
- Gen AI Demands Specialized Metrics: Traditional metrics are insufficient for Gen AI; critical user experience indicators like Time to First Token (TTFT), Inter Token Latency (ITL), and token throughput must be meticulously monitored.
- Actionable Dashboards Drive Proactive Management: Effective observability dashboards go beyond mere data display, offering "at-a-glance clarity," high cardinality, drill-down capabilities, and contextual data (traces, logs) to enable proactive problem detection and informed decision-making.
- Burn Rate Alerting is Superior for Error Budget Management: Leveraging burn rate-based alerting across multiple time windows allows teams to differentiate between transient issues and slow, persistent degradation, enabling tailored and timely responses to protect the error budget.
- Observability is an Evolving Product, Not a Static Toolset: The most resilient platforms treat observability as a continuous development process, constantly refining SLOs, metrics, and alerts based on incident feedback, data analysis, and evolving user needs.
- Integrate Open Source Tools for a Robust Stack: Tools like OpenTelemetry for instrumentation, Prometheus for metrics, and Envoy for gateway management provide a powerful, open-source foundation for building a comprehensive and resilient observability stack.
About the Speaker(s)
Alexa Griffith is a Senior Software Engineer at Bloomberg, where her work focuses on building the company's AI inference platform. Her expertise lies in the engineering challenges associated with deploying and managing AI models at scale, ensuring their reliability and performance.
Ankita Chaudhari is a Senior Product Manager at Bloomberg, specializing in computer infrastructure. Her role involves defining and guiding the development of infrastructure solutions that support Bloomberg's advanced technological needs, including the complex demands of their AI platforms.
Reviews
Dr. Zero (Offensive Security Researcher) — STRONG ACCEPT
This KubeCon talk from Bloomberg provides a robust, real-world blueprint for taming the "GenAI Hydra" through rigorous application of Service Level Objectives (SLOs) and advanced observability. It cuts through the typical AI hype by focusing on concrete, user-centric metrics like Time to First Token (TTFT) and Inter Token Latency (ITL), alongside sophisticated burn rate alerting, to manage the complex reliability challenges of enterprise-scale AI platforms. The speakers, clearly operating in the trenches, demonstrate how to shift from reactive monitoring to a proactive, "observability as a product" mindset, offering highly actionable insights for anyone building or defending large-scale AI…
Heather Calloway (CISO) — STRONG ACCEPT
This talk offers a clear and actionable framework for managing the reliability of complex AI platforms, particularly those supporting Generative AI, through robust Service Level Objectives (SLOs) and sophisticated observability. It effectively translates technical challenges into a language of accountability and business impact, providing platform teams and security leaders with the tools to move from reactive monitoring to proactive risk management. The focus on specialized Gen AI metrics and burn rate alerting makes this a highly relevant and valuable contribution to institutional resilience.