Lightning Talk: Observability Diet: Your 5-Step Plan To Trim the Data Fat - Pranay Prateek, SigNoz
Pranay Prateek, SigNoz
KubeCon + CloudNativeCon Europe 2025 · Lightning Talk
Overview
In this insightful lightning talk, Pranay Prateek, co-founder and maintainer at SigNoz, addresses a pervasive challenge in modern software development: the ever-growing volume and cost of observability data. Titled "Observability Diet: Your 5-Step Plan To Trim the Data Fat," the presentation provides practical strategies for organizations to optimize their observability data streams, particularly when leveraging OpenTelemetry. The core objective is to help engineering teams achieve a better Return on Investment (ROI) from their observability efforts, a metric frequently scrutinized by finance departments.
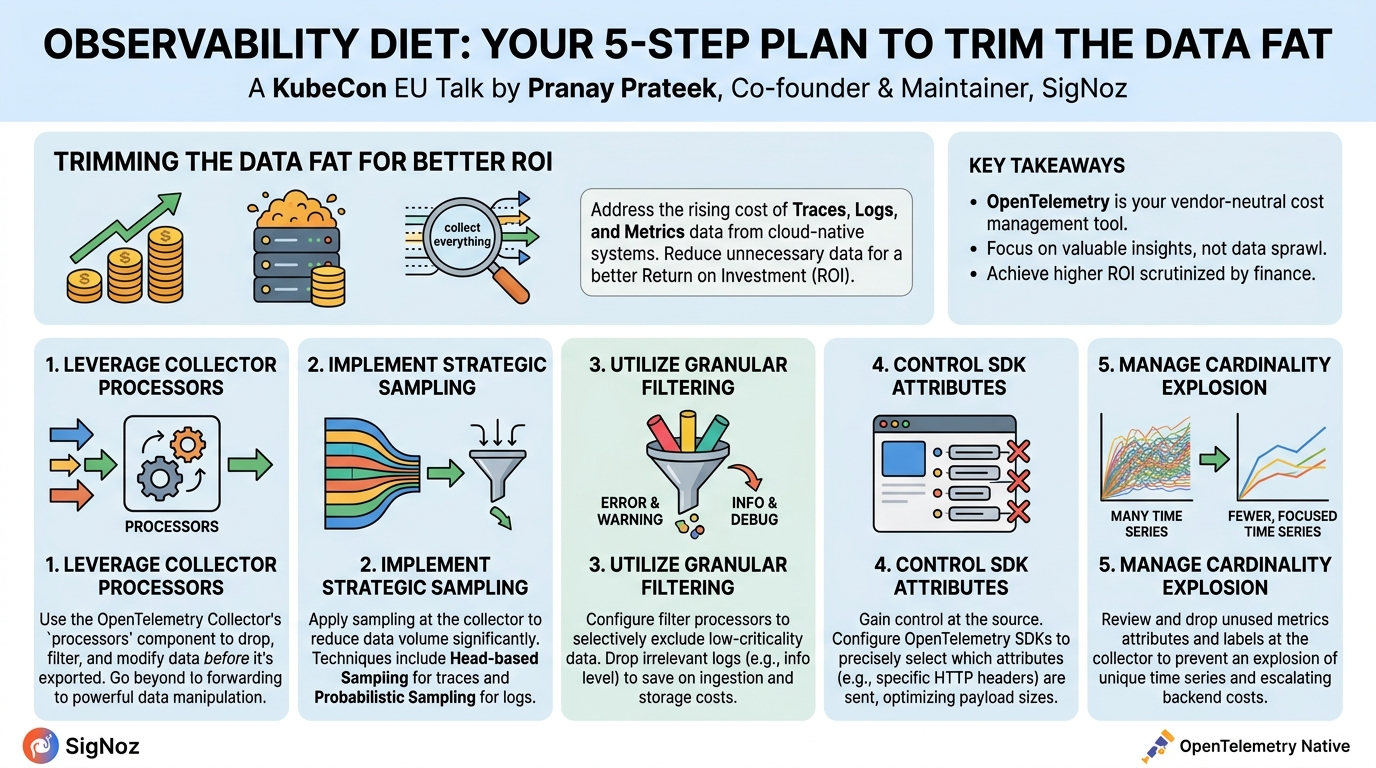
Key moments
- 0:00 Introduction and the observability data cost problem
- 1:05 Understanding OpenTelemetry Collector architecture and optimization
- 1:50 Optimize data volume with OpenTelemetry sampling strategies
- 2:40 Granular filtering and processing logs at OTel Collector
- 3:45 Manage SDK attributes and prevent cardinality explosion
- 4:10 Customize auto-instrumented metrics using OTel SDK Views
- 4:30 Reduce costs with granular data retention settings
Observability Diet: Your 5-Step Plan To Trim the Data Fat
Speakers: Pranay Prateek, Co-founder & Maintainer, SigNoz
Conference: KubeCon EU
YouTube: https://www.youtube.com/watch?v=xE3iMfib2LA
Overview
In this insightful lightning talk, Pranay Prateek, co-founder and maintainer at SigNoz, addresses a pervasive challenge in modern software development: the ever-growing volume and cost of observability data. Titled "Observability Diet: Your 5-Step Plan To Trim the Data Fat," the presentation provides practical strategies for organizations to optimize their observability data streams, particularly when leveraging OpenTelemetry. The core objective is to help engineering teams achieve a better Return on Investment (ROI) from their observability efforts, a metric frequently scrutinized by finance departments.
The talk highlights that while observability – encompassing traces, logs, and metrics – is crucial for understanding system health and performance, its associated costs can quickly become prohibitive. Prateek draws upon SigNoz's extensive experience with users and customers, detailing common pain points and effective solutions for managing data sprawl. By focusing on intelligent data processing at various stages, from the SDK to the OpenTelemetry Collector, the talk empowers developers to make informed decisions about what data to collect, process, and ultimately store, ensuring that only valuable insights contribute to the overall cost.
This discussion is particularly relevant in today's cloud-native landscape, where distributed systems generate an unprecedented amount of telemetry. Without a deliberate strategy for data management, organizations risk incurring substantial expenses for data they may not even be effectively utilizing. Prateek's "observability diet" offers a structured approach to tackle this issue, emphasizing the power of OpenTelemetry as a vendor-neutral framework for achieving significant cost reductions and improving the overall efficiency of observability pipelines.
Background
▶ Watch: Introduction and the observability data cost problem (0:00)
The proliferation of microservices architectures, cloud-native deployments, and distributed systems has led to an exponential increase in the volume and complexity of observability data. Organizations now routinely collect vast quantities of traces, logs, and metrics to monitor application performance, troubleshoot issues, and ensure system reliability. While this wealth of data is invaluable for operational insights, it comes at a significant cost. Storage, processing, and ingestion fees from observability backends can quickly escalate, leading to budget overruns and difficult conversations with finance teams questioning the ROI of these expenditures.
The problem isn't just about the sheer volume; it's also about the relevance of the data being collected. Often, default instrumentation settings or a "collect everything" mentality result in capturing a significant amount of telemetry that is never actually used for dashboards, alerts, or deep analysis. This "data fat" contributes directly to unnecessary costs without providing commensurate value. The challenge lies in striking a balance: collecting enough data to maintain comprehensive visibility without drowning in irrelevant information or breaking the bank.
OpenTelemetry has emerged as a critical standard in this context. As an open-source, vendor-agnostic framework for instrumenting, generating, collecting, and exporting telemetry data, it offers a unified approach to observability. The typical architecture involves an application running on a VM or container, instrumented with an OpenTelemetry SDK. This SDK sends data to an OpenTelemetry Collector, which then forwards it to an observability backend like SigNoz or Prometheus. While OpenTelemetry provides powerful instrumentation capabilities, its true potential for cost optimization often goes unexplored. Many users are unaware of the granular control and processing capabilities embedded within the OpenTelemetry Collector and SDKs, which can be leveraged to intelligently filter, sample, and transform data before it reaches the expensive backend. This talk aims to shed light on these often-overlooked optimization strategies, turning OpenTelemetry from just a data collection tool into a powerful cost-management instrument.
Key Findings
▶ Watch: Optimize data volume with OpenTelemetry sampling strategies (1:50)
The central theme of Pranay Prateek's talk is that significant cost savings and improved ROI for observability data can be achieved by intelligently processing and filtering telemetry at various stages of the OpenTelemetry pipeline. The key findings revolve around leveraging the often-underutilized capabilities of the OpenTelemetry Collector and SDKs to reduce data volume and manage cardinality effectively.
The primary discoveries and contributions presented include:
- OpenTelemetry Collector's Processing Power: The OpenTelemetry Collector is not merely a data forwarder but a highly configurable processing engine. Its
processorscomponent offers robust capabilities for dropping attributes, filtering data based on criteria, and deduplication, which are critical for an "observability diet." - Strategic Sampling for Data Reduction: Implementing various sampling techniques at the collector level can drastically cut down on data volume without losing critical insights. Specific methods highlighted include database sampling processors, head-based sampling for traces, and probabilistic sampling for logs, allowing organizations to collect a representative subset rather than every single event.
- Granular Filtering and Attribute Control: Fine-grained control over what data is sent is paramount. This includes configuring processors like the Kubernetes attributes processor and filter processor to exclude irrelevant information. A practical example given is filtering out
infolevel logs to only senderrorandwarninglogs, leading to substantial cost savings on log ingestion and retention. - SDK-Level Optimization: Beyond the collector, optimization can begin even earlier at the OpenTelemetry SDK level. Developers can control which attributes, such as specific HTTP headers, are sent, thereby reducing the payload size of individual telemetry items.
- Cardinality Management is Crucial: Unmanaged cardinality in metrics, often caused by sending too many unique labels or attributes, leads to an explosion in the number of time series and corresponding costs. A key finding is the necessity of reviewing and dropping unused attributes and labels at the collector level to prevent this "cardinality explosion."
- Custom Metrics via OpenTelemetry Views: While auto-instrumentation provides a wealth of default metrics, many may not be actively used. OpenTelemetry SDKs offer views, a powerful feature allowing users to customize and select precisely which metrics are sent, ensuring only valuable data contributes to costs.
- Intelligent Retention Policies: Optimizing storage costs involves implementing more granular retention settings. Different types of data (e.g., highly critical errors vs. routine info logs) may not require the same lengthy retention periods, and adjusting these settings can yield significant savings.
These findings collectively underscore that an active, strategic approach to observability data management, deeply integrated with OpenTelemetry, is essential for achieving cost efficiency and maximizing the ROI of observability investments.
Technical Deep Dive
▶ Watch: Granular filtering and processing logs at OTel Collector (2:40)
The technical core of Pranay Prateek's presentation lies in the practical application of OpenTelemetry components for data optimization. The discussion primarily focuses on the OpenTelemetry Collector and OpenTelemetry SDK, detailing specific processors and features that enable a targeted "observability diet."
The OpenTelemetry architecture, as described, typically involves an application sending telemetry data via an OpenTelemetry SDK to an OpenTelemetry Collector, which then exports it to an observability backend like SigNoz or Prometheus. The key insight is that the Collector, often seen as a simple forwarder, is a powerful processing engine. It comprises three main components: receivers (for ingesting data), processors (for transforming and filtering data), and exporters (for sending data to various backends). The processors are where the bulk of data optimization magic happens.
One of the most effective strategies is sampling. The OpenTelemetry Collector offers various sampling processors:
- Database sampling processors: While not explicitly detailed, these would likely involve intelligent sampling of traces or logs related to database interactions, ensuring that critical performance insights are retained without capturing every single query.
- Head-based sampling: This is a crucial technique for traces, where the decision to sample a trace (and all its associated spans) is made at the very beginning of the trace's lifecycle. This ensures that a complete trace, if sampled, is collected, providing end-to-end visibility for a subset of requests.
- Probabilistic sampling for logs: For high-volume log streams where every log entry isn't critical, probabilistic sampling allows a configurable percentage of logs to be collected. For example, if only 10% of
infologs are needed for general trend analysis, this method can significantly reduce log ingestion costs.
Beyond sampling, granular control and filtering are paramount. The Collector provides specific processors for this:
- Kubernetes attributes processor: This processor enriches telemetry data with Kubernetes-specific metadata (pod names, namespaces, etc.). While primarily for enrichment, it can be configured to selectively include or exclude certain attributes, indirectly contributing to data reduction if specific Kubernetes labels are deemed unnecessary.
- Filter processor: This is a direct and powerful tool for explicitly filtering out unwanted data. Prateek emphasizes its use for reducing log volume. A common and highly effective application is to filter logs based on their severity level. For instance, configuring the filter processor to only pass
errorandwarninglogs to the backend, while dropping allinfoordebuglogs, can lead to substantial savings on data ingestion and retention costs. This ensures that only the most critical operational insights are stored long-term. Similarly, attributes can be dropped at this stage if they contribute to high cardinality or are simply not used in dashboards or alerts.
The optimization doesn't stop at the Collector. The OpenTelemetry SDK itself offers capabilities for data control:
- Attribute-based control: At the SDK level, developers can precisely control which attributes are attached to telemetry data. For example, when capturing HTTP request details, instead of sending all HTTP headers, the SDK can be configured to send only specific, relevant headers, thus reducing the overall data payload size for each span or log entry.
A significant technical challenge addressed is cardinality explosion in metrics. Metrics are often enriched with various labels or attributes (e.g., user_id, session_id, request_path). If these labels have a high number of unique values, they create a vast number of unique time series. Each unique combination of metric name and labels constitutes a distinct time series, and observability backends charge based on the number of active time series. Prateek advises a careful review of all attributes and labels being sent. If an attribute is not used in any dashboard, alert, or analytical query, it should be dropped, ideally at the OpenTelemetry Collector level, to prevent unnecessary time series creation and associated costs.
Finally, the talk highlights OpenTelemetry Views. When applications are auto-instrumented, the default settings often generate a large number of metrics. Views, a feature within the OpenTelemetry SDKs, allow developers to customize exactly which metrics are collected and how they are aggregated. This means that if only a subset of auto-generated metrics is relevant for monitoring, views can be configured to suppress or transform the others, ensuring that only actively utilized metrics are exported, further trimming the "data fat."
Collectively, these technical strategies empower engineers to build highly efficient and cost-effective observability pipelines, moving beyond a "collect everything" approach to a more intelligent, value-driven data collection paradigm.
Demo / Proof of Concept
▶ Watch: Customize auto-instrumented metrics using OTel SDK Views (4:10)
This presentation was delivered as a lightning talk, focusing on high-level strategies and conceptual approaches for optimizing observability data. As such, the speaker did not include a live demonstration or a detailed proof of concept during the session. The content primarily consisted of strategic advice and technical recommendations based on SigNoz's experience with OpenTelemetry implementations.
Defensive Implications
▶ Watch: Reduce costs with granular data retention settings (4:30)
While the talk primarily focuses on cost optimization for observability data, its implications for defensive security are significant, albeit indirect. Effective observability is a cornerstone of a robust security posture, enabling early detection of anomalies, faster incident response, and comprehensive post-mortem analysis. By adopting the strategies outlined by Pranay Prateek, security teams can inadvertently enhance their defensive capabilities in several ways:
- Improved Signal-to-Noise Ratio: By filtering out irrelevant or low-criticality data (e.g., dropping
infologs and retaining onlyerrorandwarninglogs), security analysts can significantly reduce the "noise" in their monitoring systems. This allows them to focus on high-fidelity alerts and critical events that are more likely to indicate a security incident or compromise, improving the efficiency of threat detection and incident triage. - Affordable Retention of Critical Data: Cost optimization means that organizations can afford to retain critical security-relevant logs and traces for longer periods. This is crucial for forensic investigations, compliance requirements, and identifying long-term attack patterns (e.g., advanced persistent threats) that might span weeks or months. Without an "observability diet," budget constraints might force shorter retention periods for all data, potentially hindering security investigations.
- Enhanced Anomaly Detection: Optimized data pipelines ensure that the right data is available for anomaly detection engines. By reducing overall data volume and managing cardinality, the performance of these engines can improve, leading to more accurate baselines and quicker identification of deviations that could signal a security breach or unusual activity (e.g., unusual user behavior, unauthorized access attempts).
- Better Context for Incident Response: Granular control over attributes, especially at the SDK level, allows security teams to ensure that specific security-relevant attributes (e.g.,
user_agent,source_ip, authentication status) are always collected and preserved. This rich context is invaluable during incident response, helping analysts quickly understand the scope and impact of an attack. - Proactive Security Posture: Understanding what data is being collected and why, as encouraged by the talk's emphasis on ROI, forces a more deliberate approach to observability. This can extend to security telemetry, prompting teams to review and ensure they are collecting the necessary security events without being overwhelmed by extraneous information. This proactive stance helps in identifying gaps in security monitoring coverage.
In essence, by making observability more efficient and cost-effective, organizations free up resources and enhance the clarity of their data, which directly translates into a more agile, informed, and ultimately stronger defensive security posture.
Key Takeaways
- OpenTelemetry Collector is a Powerful Data Processor: Leverage the
processorscomponent of the OpenTelemetry Collector for advanced data manipulation, including filtering, sampling, and deduplication, to significantly reduce observability data volume. - Strategic Sampling Reduces Costs: Implement sampling techniques like head-based sampling for traces and probabilistic sampling for logs to collect a representative subset of data, saving on ingestion and storage costs without sacrificing critical insights.
- Granular Filtering is Essential: Utilize filter processors to selectively drop irrelevant data, such as
infoordebuglogs, and only send high-criticality events likeerrorandwarninglogs to your backend. - Control Data at the SDK Level: Employ OpenTelemetry SDK features to precisely control which attributes (e.g., specific HTTP headers) are sent, optimizing payload size and ensuring only necessary context is captured.
- Manage Cardinality to Prevent Cost Explosion: Regularly review and drop unused attributes and labels at the collector level to prevent cardinality explosion in metrics, which can drastically increase the number of time series and associated costs.
- Customize Metrics with OpenTelemetry Views: Use the
viewsfeature in OpenTelemetry SDKs to select and customize which metrics are exported, ensuring that only actively utilized and valuable metrics contribute to your observability expenses.
About the Speaker(s)
Pranay Prateek is a co-founder and maintainer at SigNoz, an open-source observability platform. SigNoz distinguishes itself by being OpenTelemetry native, offering a unified "single pane" for managing traces, logs, and metrics. Prateek's insights in this talk are drawn from extensive conversations and experiences with SigNoz's users and customers, who frequently grapple with the challenges of managing large volumes of observability data and justifying its cost. His expertise lies in helping organizations optimize their telemetry pipelines, particularly within the OpenTelemetry ecosystem, to achieve better ROI from their monitoring efforts.
Reviews
Dr. Zero (Offensive Security Researcher) — STRONG ACCEPT
This lightning talk delivers a highly practical and actionable "observability diet" plan, leveraging specific, often underutilized, features of the OpenTelemetry Collector and SDKs to significantly reduce telemetry data volume and associated costs. The speaker, a co-founder of an OpenTelemetry-native platform, clearly demonstrates deep technical knowledge in guiding engineers through intelligent sampling, granular filtering, cardinality management, and custom metric views. While the core OpenTelemetry components aren't novel discoveries, the systematic approach and emphasis on cost optimization through these specific mechanisms offer valuable, immediate impact for any organization…