Where’s All My Memory Gone? Mapping K8s Memory Metrics To Physical Resources - Mahé Tardy
Mahé Tardy
KubeCon + CloudNativeCon Europe 2025 · Session
Overview
Mahé Tardy, a software engineer at Isovalent (Cisco) working on the eBPF-based runtime security project Tetragon (part of Cilium), delivered a highly informative talk at KubeCon EU addressing a common point of confusion for Kubernetes operators: understanding memory metrics. Specifically, the presentation dives deep into the ubiquitous containermemoryworkingsetbytes metric, which often appears on Kubernetes dashboards but whose exact meaning and underlying computation remain opaque to many. The talk demystifies this metric by tracing its journey from a Grafana dashboard back to its origins within the Linux kernel's cgroups subsystem.
Key moments
- 0:00 Introduction and the mystery of Kubernetes memory metrics
- 2:39 Visualizing the Kubernetes metrics flow diagram
- 6:10 Identifying C advisor in Kubelet as the metric source
- 6:52 What is C advisor and its role in container monitoring?
- 7:26 C advisor's computation of memory metrics via cgroups
Where’s All My Memory Gone? Mapping K8s Memory Metrics To Physical Resources
Speakers: Mahé Tardy, Software Engineer, Isovalent at Cisco
Conference: KubeCon EU
YouTube: https://www.youtube.com/watch?v=zLHdgl2qxbg
Overview
Mahé Tardy, a software engineer at Isovalent (Cisco) working on the eBPF-based runtime security project Tetragon (part of Cilium), delivered a highly informative talk at KubeCon EU addressing a common point of confusion for Kubernetes operators: understanding memory metrics. Specifically, the presentation dives deep into the ubiquitous container_memory_working_set_bytes metric, which often appears on Kubernetes dashboards but whose exact meaning and underlying computation remain opaque to many. The talk demystifies this metric by tracing its journey from a Grafana dashboard back to its origins within the Linux kernel's cgroups subsystem.
The core problem Mahé identifies is the disconnect between the high-level abstractions of Kubernetes and the intricate realities of Linux memory management. Operators frequently encounter memory graphs and alerts without a clear understanding of what "memory" is actually being measured, leading to challenges in capacity planning, debugging Out-Of-Memory (OOM) errors, and optimizing resource allocation. This talk is crucial for anyone managing Kubernetes clusters, offering a transparent breakdown of how container memory usage is reported and what these numbers truly represent in terms of physical resource consumption, ultimately empowering better operational decisions.
Background
▶ Watch: Introduction and the mystery of Kubernetes memory metrics (0:00)
The journey into Kubernetes memory metrics often begins with a dashboard displaying resource usage, where container_memory_working_set_bytes typically stands out as the primary indicator for container memory consumption. For many, this metric is a black box, making it difficult to interpret or correlate with actual physical memory usage. The complexity stems from multiple layers of abstraction: Kubernetes orchestrates containers, which are managed by a container runtime (e.g., containerd, CRI-O), which in turn relies on Linux kernel primitives like namespaces for isolation and cgroups for resource limiting and accounting.
Historically, Linux memory management itself is notoriously intricate, featuring concepts such as virtual memory, memory overcommit, page faults, and swapping. These mechanisms allow the kernel to provide a flexible, seemingly infinite memory space to processes while intelligently managing the finite physical RAM. This flexibility, while powerful, makes it challenging to pinpoint exactly how much physical memory a process or container is truly consuming at any given moment. Furthermore, the Out-Of-Memory (OOM) killer is a critical kernel component that steps in when the system runs out of reclaimable memory, terminating processes to free up resources. Its decisions are based on complex heuristics and scores, which Kubernetes attempts to influence through its Quality of Service (QoS) classes (Guaranteed, Burstable, BestEffort). The talk highlights that the OOM killer is a Linux-native concept, often unaware of the higher-level "container" abstraction, leading to potential discrepancies where a container's main process might survive while crucial child processes are killed. This layered complexity and the inherent abstraction gaps contribute significantly to the widespread confusion surrounding Kubernetes memory metrics.
Key Findings
▶ Watch: Visualizing the Kubernetes metrics flow diagram (2:39)
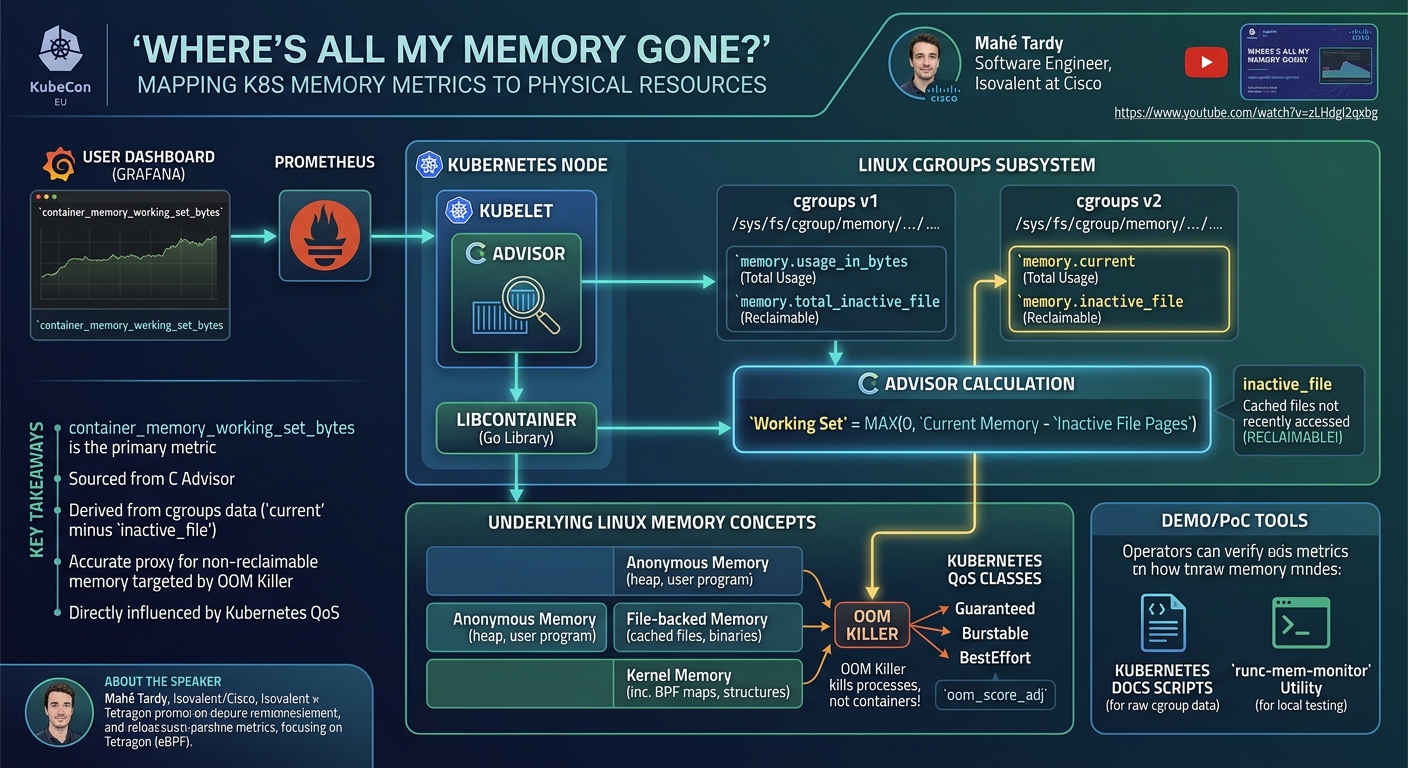
The central finding of Mahé Tardy's talk is the precise definition and computation of the container_memory_working_set_bytes metric. After a thorough investigation tracing the metric's origin through the Kubernetes metrics pipeline, it is revealed that this key metric is derived directly from Linux cgroups data, specifically as the difference between the current memory usage and inactive file pages. More precisely, for cgroups v1, it's memory.usage_in_bytes - memory.total_inactive_file, and for cgroups v2, it's memory.current - memory.inactive_file.
This subtraction is not arbitrary; it represents a crucial heuristic. The inactive_file component refers to memory pages used for cached files that have not been recently accessed and are thus readily reclaimable by the kernel if memory pressure arises. By subtracting these inactive pages, the container_memory_working_set_bytes metric aims to provide a "good enough" approximation of the memory that is actively in use by a container and, critically, the memory that the Linux OOM killer considers non-reclaimable when making decisions. This makes the metric a highly relevant indicator for predicting and preventing OOM scenarios within Kubernetes. The talk meticulously details the entire journey of this metric, from its collection by C Advisor within the Kubelet, through libcontainer's interaction with cgroups, and finally its exposure via Prometheus for consumption by dashboards like Grafana.
Technical Deep Dive
▶ Watch: Identifying C advisor in Kubelet as the metric source (6:10)
The technical deep dive begins by mapping the Kubernetes metrics flow. When an operator views a memory dashboard, typically in Grafana, the data is sourced from a Prometheus server running within or alongside the cluster. Prometheus, in turn, scrapes metrics from various endpoints. For container-specific metrics, the primary source is the C Advisor endpoint, exposed via the Kubelet on each node. The Prometheus Node Exporter, while providing node-level metrics (prefixed with node_), does not expose container-specific memory metrics.
C Advisor, a utility designed to analyze and understand resource usage of containers, is integrated directly into the Kubelet. It relies heavily on runc's libcontainer library, a pure Go implementation for interacting with containers. When C Advisor needs to compute memory statistics, it calls libcontainer's cgroup package. This package is responsible for reading various statistics from the cgroup filesystem, which serves as the interface between user space and the kernel's cgroup subsystem.
Cgroups (control groups) are a fundamental Linux kernel feature for organizing processes hierarchically and distributing or restricting system resources among them. There are two main versions: cgroups v1 and cgroups v2, with subtle differences in how metrics are named and reported. Kubernetes leverages cgroups to enforce resource requests and limits defined for pods. This is intrinsically tied to Kubernetes' Quality of Service (QoS) classes:
- Guaranteed: When a container has CPU and memory requests equal to its limits.
- Burstable: When a container has requests set, but limits are higher than requests, or only requests are set.
- BestEffort: When no requests or limits are set.
These QoS classes are not mere labels; Kubernetes translates them into specific cgroup configurations. For instance, the OOM killer, a kernel mechanism, uses an oom_score_adj value to determine which processes to kill under memory pressure. Kubernetes manipulates this score based on QoS classes: Guaranteed pods receive the lowest (most favorable) score, making them less likely to be killed, while BestEffort pods receive the highest (least favorable) score, making them prime targets. This system ensures that critical workloads are protected during memory contention. Cgroups are organized hierarchically, typically represented in a filesystem structure under /sys/fs/cgroup. Kubernetes creates a kubepods slice, which is further divided into guaranteed, burstable, and besteffort slices, containing the respective pods and their containers.
The core of the container_memory_working_set_bytes calculation occurs within C Advisor's setMemoryStats function. This function retrieves two key values from the cgroup memory controller:
- Usage/Current Memory: For cgroups v1, this is
memory.usage_in_bytes; for cgroups v2, it'smemory.current. This value represents the total memory currently accounted to the cgroup. - Inactive File Pages: For cgroups v1, this is
memory.total_inactive_file; for cgroups v2, it'smemory.inactive_file. These are memory pages associated with files that are cached but have not been recently used, making them prime candidates for reclamation by the kernel.
The container_memory_working_set_bytes is then calculated as max(0, Usage/Current Memory - Inactive File Pages). This subtraction is critical because it attempts to filter out memory that the kernel can easily reclaim, providing a more accurate picture of actively used, non-reclaimable memory.
Understanding this calculation requires a brief foray into Linux memory concepts:
- Main Memory (Physical RAM): The actual, fast hardware memory.
- Virtual Memory: An abstraction provided by the kernel, giving each process its own seemingly contiguous memory space, which may or may not map directly to physical RAM.
- Memory Overcommit: Linux allows processes to allocate more virtual memory than the physical RAM available, only committing physical pages when they are actually written to (via page faults). This means an
alloc()call doesn't immediately consume physical memory. - Swapping: If physical memory runs low, the kernel can move less-used memory pages from RAM to a slower storage device (swap space).
The memory.current (or memory.usage_in_bytes) metric from cgroups is a total accounting that includes anonymous memory (e.g., heap allocations in user programs), file-backed memory (e.g., cached files, program binaries), and kernel memory (kernel structures related to the process). The inactive_file component specifically targets the reclaimable portion of the file-backed memory. For advanced eBPF-based tools like Tetragon, the memory impact of BPF maps (kernel data structures used by eBPF programs) is accounted for within the kernel category of the cgroup memory statistics, further illustrating the complexity of accurate memory attribution.
Demo / Proof of Concept
▶ Watch: What is C advisor and its role in container monitoring? (6:52)
While the talk did not feature a live, interactive demo in the traditional sense, Mahé Tardy presented two practical tools and approaches that serve as effective proofs of concept for understanding and monitoring memory usage:
- Kubernetes Documentation Scripts: The speaker highlighted the existence of useful scripts within the Kubernetes documentation. These scripts allow users to directly inspect the raw cgroup memory statistics for their pods and containers. By running these scripts, operators can bypass the aggregated metrics and see the underlying
working_set_bytes,inactive_file, and other detailed memory breakdown values, effectively validating the calculation explained in the talk. This provides a direct, low-level view into how the kernel and C Advisor perceive memory usage.
runc-mem-monitorUtility: Mahé also introduced a small, personal utility calledrunc-mem-monitor. This tool, built using libcontainer (the same library C Advisor uses), allows users to run any program as a child process within its own cgroup. The utility then monitors and prints the cgroup memory statistics, including the working set and inactive file pages, at regular intervals. The goal ofrunc-mem-monitoris to provide a lightweight way to analyze an application's memory footprint without needing to deploy a full Kubernetes cluster or even Docker. It simulates the data collection process that C Advisor performs, making it an excellent educational and debugging tool for developers wanting to understand how their application's memory usage translates to cgroup metrics before deploying to Kubernetes.
These examples demonstrate how the concepts discussed in the talk can be practically applied to gain deeper insights into memory consumption, both within and outside a Kubernetes environment.
Defensive Implications
▶ Watch: C advisor's computation of memory metrics via cgroups (7:26)
Understanding the intricacies of Kubernetes memory metrics, particularly container_memory_working_set_bytes, is paramount for robust defensive strategies in a cloud-native environment. The primary implication is the ability to accurately predict and prevent Out-Of-Memory (OOM) kills. Since container_memory_working_set_bytes is the metric that best reflects the non-reclaimable memory targeted by the OOM killer, monitoring this value allows operators to set more realistic and effective memory limits for their pods.
Defenders should:
- Prioritize
container_memory_working_set_bytes: Instead of relying solely onmemory.usage_in_bytes(which includes reclaimable file cache), usecontainer_memory_working_set_bytesas the primary indicator for a container's active memory consumption. This helps in avoiding false positives for memory alerts and more accurately reflects actual memory pressure. - Tune Memory Requests and Limits: With a clearer understanding of the "working set," organizations can set more precise memory requests and limits. Setting requests too low can lead to poor scheduling and increased OOM risk for
BurstableandBestEffortpods. Setting limits too high can lead to inefficient resource utilization, while setting them too low (relative to the working set) will result in frequent OOM kills. Baseline thecontainer_memory_working_set_bytesfor typical workloads to inform these critical configurations. - Leverage QoS Classes Strategically: Understand how Kubernetes QoS classes (Guaranteed, Burstable, BestEffort) translate into
oom_score_adjvalues in the kernel. Critical applications that must avoid OOM kills should be configured asGuaranteedby setting equal memory requests and limits. Less critical or batch workloads can beBurstableorBestEffort, acknowledging their higher risk of being killed under memory pressure. - Debug OOM Issues More Effectively: When an OOM occurs, the knowledge that
container_memory_working_set_bytesis the key metric, and that it's derived from cgroup data (current usage minus inactive files), provides a crucial starting point for investigation. Operators can examine raw cgroup statistics (using tools like the Kubernetes documentation scripts orrunc-mem-monitor) to understand the breakdown of memory usage (anonymous, file, kernel) and identify if the issue is due to excessive heap usage, large file caches, or kernel-related allocations (e.g., BPF maps). - Optimize Resource Allocation: By understanding what constitutes "active" memory, teams can optimize cluster resource allocation. Reducing unnecessary memory limits can free up capacity for other workloads, leading to better cluster density and cost efficiency, without compromising stability.
- Be Aware of Kernel/Container Discrepancies: Remember that the Linux OOM killer is not container-aware. It kills processes, not containers. This means a critical sidecar or background process within a pod could be killed, even if the main application process survives, leading to unexpected application failures. Understanding this nuance helps in designing more resilient applications and monitoring strategies.
In essence, a deep understanding of container_memory_working_set_bytes provides the clarity needed to move beyond guesswork in Kubernetes memory management, leading to more stable, efficient, and resilient deployments.
Key Takeaways
container_memory_working_set_bytesis the primary and most relevant memory metric tracked in Kubernetes for pods, as seen in dashboards like Grafana.- This metric is sourced from C Advisor, which is embedded within the Kubelet, and relies on libcontainer to interact with the Linux cgroups subsystem.
- The
container_memory_working_set_bytesmetric is computed as the difference between the total current memory usage (e.g.,memory.currentfor cgroups v2) and the inactive file cache (e.g.,memory.inactive_file). - This calculation represents a "good enough" heuristic for actively used memory, closely aligning with what the Linux Out-Of-Memory (OOM) killer targets when reclaiming resources.
- Kubernetes Quality of Service (QoS) classes (Guaranteed, Burstable, BestEffort) directly influence the
oom_score_adjvalues set in cgroups, dictating the OOM killer's preference for terminating pods under memory pressure. - Understanding the underlying Linux memory concepts—such as virtual memory, memory overcommit, and the breakdown of
memory.currentinto anonymous, file, and kernel components—is crucial for debugging and optimizing memory usage in Kubernetes.
About the Speaker(s)
Mahé Tardy is a Software Engineer at Isovalent, a company that has since been acquired by Cisco. His work focuses on Tetragon, an eBPF-based runtime security project that is part of the broader Cilium ecosystem. Mahé's expertise lies in deep-diving into Linux kernel internals and how they interact with cloud-native technologies like Kubernetes, particularly concerning resource management and security. His background in developing low-level system tools and understanding complex abstractions makes him well-suited to demystify topics such as memory accounting in containerized environments.
Reviews
Dr. Zero (Offensive Security Researcher) — MUST SEE
This talk cuts through the typical Kubernetes metrics fog, providing a brutally honest and technically rigorous dissection of containermemoryworkingsetbytes. Tardy doesn't just show you a graph; she rips apart the abstraction layers, tracing this critical metric from Grafana dashboards all the way down to its cgroup v1/v2 kernel origins. This isn't marketing fluff; it's essential, actionable knowledge for anyone tired of playing guessing games with OOM kills and capacity planning. It's a masterclass in understanding what your systems are actually doing.
Heather Calloway (CISO) — STRONG ACCEPT
Mahé Tardy's KubeCon talk meticulously demystifies Kubernetes memory metrics, specifically containermemoryworkingsetbytes, by tracing its calculation from dashboards back to Linux cgroups and the OOM killer. This technical deep dive provides critical clarity for operators struggling with OOM errors and capacity planning, offering a precise understanding of what "active" memory truly means. From a governance perspective, this knowledge is foundational for ensuring platform resilience, optimizing resource allocation, and maintaining application availability, directly impacting business continuity and cost efficiency.