An Exemplary Path: Leveraging EBPFs and OpenTelemetry To Aut... Charlie Le & Kruthika Prasanna Simha
Charlie Le, Kruthika Prasanna Simha
KubeCon + CloudNativeCon Europe 2025 · Session
Overview
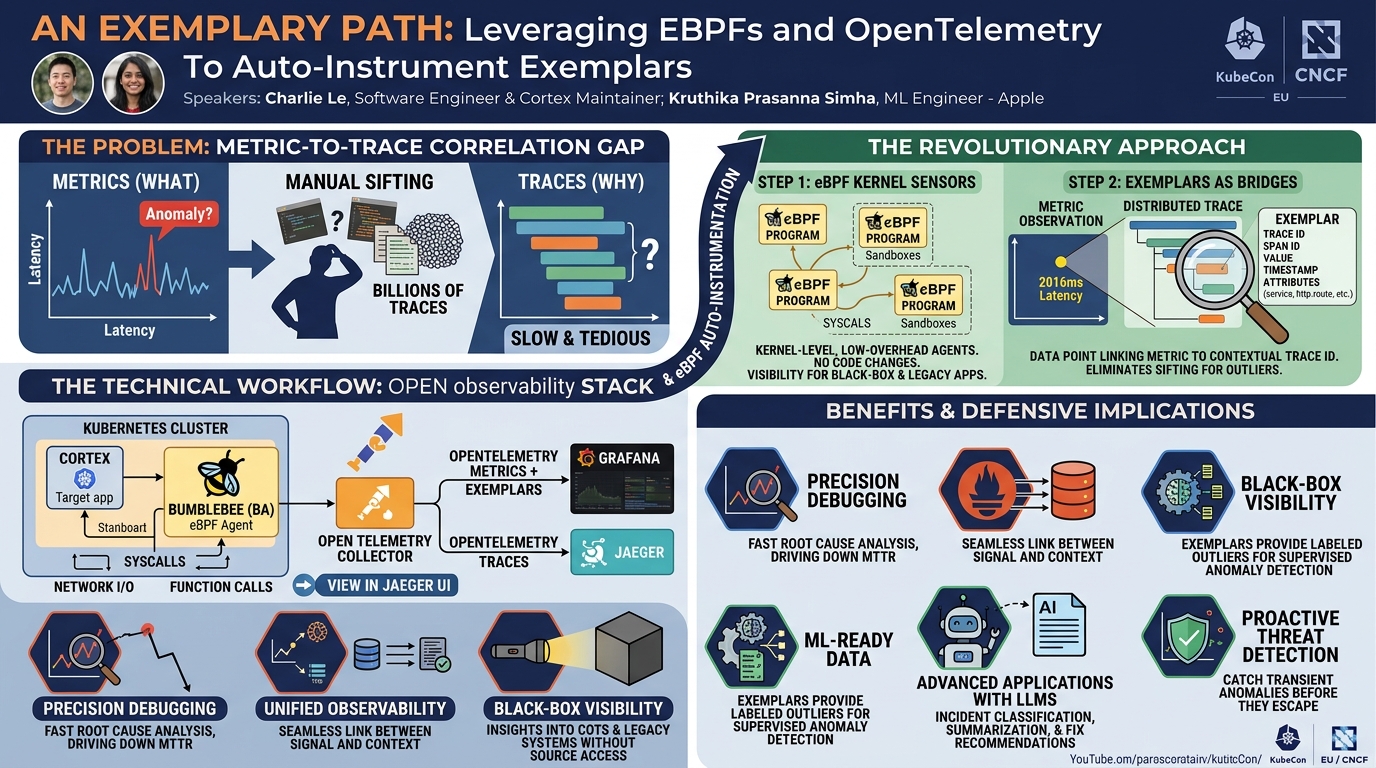
In the complex landscape of modern distributed systems, debugging performance issues and identifying root causes remains a significant challenge. Traditional observability stacks often present data in silos: metrics show what is happening, while traces and logs detail why it's happening. The arduous task of manually correlating an anomalous metric spike with a specific slow trace or relevant log entry consumes valuable engineering time and delays incident resolution. This talk, "An Exemplary Path," addresses this critical problem by introducing a powerful paradigm shift: exemplars.
Key moments
- 0:00 Introduction to exemplars and eBPF
- 2:20 Understanding exemplars: linking metrics to traces
- 4:00 Challenges of manual instrumentation for exemplars
- 4:50 eBPF: The superpower for auto-instrumentation
- 6:00 Demo overview: eBPF auto-instrumentation for exemplars
- 7:30 Live demo: Setting up Kubernetes with eBPF
- 8:00 Key components used in the demo setup
An Exemplary Path: Leveraging EBPFs and OpenTelemetry To Auto-Instrument Exemplars
Speakers: Charlie Le, Software Engineer, Apple & Maintainer for Cortex; Kruthika Prasanna Simha, Machine Learning Engineer, Apple
Conference: KubeCon EU
YouTube: https://www.youtube.com/watch?v=u-eUO3rIQV4
Overview
In the complex landscape of modern distributed systems, debugging performance issues and identifying root causes remains a significant challenge. Traditional observability stacks often present data in silos: metrics show what is happening, while traces and logs detail why it's happening. The arduous task of manually correlating an anomalous metric spike with a specific slow trace or relevant log entry consumes valuable engineering time and delays incident resolution. This talk, "An Exemplary Path," addresses this critical problem by introducing a powerful paradigm shift: exemplars.
Presented by Charlie Le and Kruthika Prasanna Simha of Apple, this session at KubeCon EU delves into how eBPF (extended Berkeley Packet Filter) and OpenTelemetry can be leveraged to automatically instrument these exemplars. The core premise is to create a seamless link between high-level metrics and their underlying distributed traces and logs, enabling engineers to jump directly from an observed anomaly to its precise contextual details. This capability promises to significantly supercharge observability and debugging workflows, transforming reactive incident response into a more precise and efficient process.
The talk highlights a practical, zero-code instrumentation approach, demonstrating how these technologies can provide deep, high-resolution visibility even into black-box or legacy applications. By automating the collection and correlation of critical telemetry, the speakers illustrate a path toward faster root cause analysis, proactive alerting, and even advanced machine learning applications that can further enhance system understanding and incident management.
Background
▶ Watch: Introduction to exemplars and eBPF (0:00)
The journey to effective system observability often begins with monitoring metrics. Dashboards displaying request latency, error rates, or resource utilization are the first line of defense, signaling when something is amiss. However, a rising latency graph, while indicating a problem, rarely provides enough information to pinpoint the exact cause. The next logical step for an engineer is typically to dive into distributed traces. Modern applications, especially those built on microservices architectures, generate a plethora of traces, each representing the full execution path of a single request across multiple services. Sifting through these "billions of traces," as the speakers alluded to during the Q&A, to find the specific trace corresponding to an anomalous metric spike is a notoriously tedious and time-consuming process. This manual correlation is a significant pain point in current debugging workflows.
The concept of exemplars emerges as a direct solution to this correlation gap. An exemplar is essentially a data point that directly links a specific metric observation to a corresponding trace and/or log entry. It acts as a bridge, embedding the trace ID and span ID directly alongside the metric data point itself. This allows an engineer, upon observing a metric outlier, to immediately jump to the exact trace that generated that outlier, providing rich, contextual information for debugging. Exemplars are typically stored alongside metrics in the metrics data store and are often visualized as distinct markers (like a yellow dot) on a metric graph, highlighting the specific data point that triggered the exemplar. Beyond just trace and span IDs, exemplars can also carry additional attributes, offering even more contextual depth about the event.
While the benefits of exemplars are clear, the challenge traditionally lies in their instrumentation. Manually instrumenting every application, service, and external dependency to collect the necessary metrics, traces, and logs, and then ensuring they are correctly linked with exemplars, introduces significant overhead. This involves code changes, redeployments, and the risk of incomplete coverage, making it a daunting task for large, complex environments. This is where the power of eBPF (extended Berkeley Packet Filter) becomes revolutionary. eBPF is a powerful in-kernel virtual machine that allows developers to run small, sandboxed programs within the Linux kernel without modifying the kernel's source code or even the application's code. This capability enables high-performance, low-overhead observability by tapping directly into kernel events, providing a mechanism for "zero-code instrumentation" that overcomes the limitations of manual approaches.
Key Findings
▶ Watch: Challenges of manual instrumentation for exemplars (4:00)
The talk presents several key findings and contributions that collectively redefine how observability can be achieved and leveraged:
- Exemplars as the Bridging Mechanism: The central finding is the effective use of exemplars to directly link high-level metrics to detailed distributed traces and logs. This eliminates the manual "sifting" process, enabling precision debugging and significantly reducing the time spent on root cause analysis. Exemplars, by storing trace and span IDs alongside metric data points, transform an abstract metric observation into a direct gateway to contextual telemetry.
- eBPF for Zero-Code Auto-Instrumentation: The introduction of eBPF as a mechanism for automatic exemplar instrumentation is a critical innovation. By operating at the kernel level, eBPF allows for the capture of low-level signals (like syscalls and network requests) without any modifications to the application code itself. This provides high-resolution visibility into application behavior, even for black-box or legacy services, with minimal performance overhead. This capability is particularly beneficial in Kubernetes environments, where eBPF agents can seamlessly integrate into the observability stack.
- Highlighting Outliers and Context-Rich Observability: Exemplars inherently highlight momentary outliers in metric data that might otherwise be obscured by aggregation. These distinct data points, enriched with numerous attributes beyond just trace and span IDs (e.g., HTTP method, status code, RPC method, service names), provide a much richer "story" about the anomaly. This context-rich observability empowers engineers to quickly grasp the full picture of an incident.
- OpenTelemetry as the Unifying Standard: The talk demonstrates how eBPF-generated telemetry, including exemplars, can be seamlessly translated into OpenTelemetry signals. This adherence to an open standard ensures interoperability with a wide array of existing observability backends (like Prometheus for metrics and Jaeger for traces) and fosters community collaboration, making the solution widely adaptable and future-proof.
- Unlocking Advanced Machine Learning Capabilities: A significant finding is the potential of exemplars to "supercharge" observability with machine learning. Because exemplars specifically mark outliers, they provide labeled data for anomaly detection, enabling more accurate supervised ML models compared to traditional unsupervised methods. Furthermore, the linked multimodal data (metrics, logs, traces) within an exemplar creates a rich dataset for advanced analysis, including root cause recommendations, proactive alerting, and powerful applications with Large Language Models (LLMs) for incident classification, summarization, and even suggesting fixes, thereby drastically reducing Mean Time To Resolution (MTTR).
Technical Deep Dive
▶ Watch: eBPF: The superpower for auto-instrumentation (4:50)
The technical core of this exemplary path lies in the synergistic application of eBPF for data collection and OpenTelemetry for data standardization and routing.
eBPF: The Kernel Superpower
eBPF operates as a secure, sandboxed virtual machine within the Linux kernel. It allows programs to be loaded and run in response to various kernel events, such as network I/O, syscalls, or function calls, without requiring kernel recompilation or modification. This provides an unparalleled vantage point for observing system behavior with minimal overhead. For auto-instrumentation, eBPF programs can attach to specific kernel probes (kprobes, uprobes) or tracepoints to capture network requests, process execution details, and other low-level system events. The key advantages are:
- Zero-Code Instrumentation: Applications do not need to be recompiled or modified.
- High Performance: Operations occur at the kernel level, minimizing context switching and user-space overhead.
- High Resolution: Captures granular events that user-space instrumentation might miss.
- Black-Box Visibility: Ideal for gaining insight into applications where source code access is limited or modification is undesirable (e.g., third-party binaries, legacy systems).
Exemplar Structure and OpenTelemetry Integration
An exemplar is a specific data point that augments a metric, typically a histogram or summary metric, with contextual identifiers. The fundamental attributes of an exemplar include:
- Trace ID: A unique identifier for the distributed trace associated with the event.
- Span ID: A unique identifier for the specific operation (span) within that trace.
- Value: The numerical value of the metric at the time the exemplar was recorded (e.g.,
2016for a latency metric). - Timestamp: The time of the event.
- Attributes: Additional key-value pairs providing further context, such as
service.name,http.method,http.status_code,rpc.method,http.route, etc.
The demonstration utilized Bumblebee (BA), a Grafana project, as the eBPF agent. BA is designed to listen for network events and other relevant kernel activity. When an event occurs (e.g., an HTTP request or gRPC call), BA employs its knowledge of kernel hooks and function calls to interpret the event. It then translates this low-level kernel event into a structured OpenTelemetry signal. This signal includes both the metric data and, crucially, newly generated or correlated trace and span IDs, which are then injected into the metric as an exemplar.
The OpenTelemetry Collector plays a pivotal role in this architecture. It receives the OpenTelemetry-native metrics and traces generated by BA. Its function is to process, enrich, and then route these signals to appropriate backends. In the demo, metrics with exemplars were sent to Prometheus, while the detailed traces were routed to Jaeger. Grafana then served as the visualization layer, querying Prometheus for metrics and exemplars, and Jaeger for traces, enabling the seamless jump from a metric anomaly to its corresponding trace.
Auto-Instrumentation vs. Manual Instrumentation
The talk provides a balanced view of auto-instrumentation via eBPF versus traditional manual instrumentation:
- Manual Instrumentation:
- Pros: Allows for deep domain-specific context, full control over captured data, works across diverse languages and libraries.
- Cons: Requires direct code changes and redeployments, higher risk of missing coverage, significant development overhead.
- Auto-Instrumentation (eBPF):
- Pros: Zero code changes, captures low-level signals (syscalls, network latency), ideal for black-box and legacy services, broad coverage.
- Cons: Limited to what the kernel sees, harder to capture deep business-level semantics (e.g., specific user IDs or business transaction identifiers that are only visible within application logic).
A common technical concern raised during the Q&A was the potential for cardinality explosion when including highly variable attributes like HTTP paths or gRPC method names directly in exemplars, especially if BA is creating new metric series for them. The speakers acknowledged this as a valid concern. For services with uncontrolled or highly dynamic request paths, it is recommended to implement filtering logic to drop such specific attributes before they are sent, or to perform pre-aggregation to manage cardinality. However, for tightly controlled services, including these attributes can provide invaluable context. If attributes are removed from the exemplar itself, the full path information would still be available within the linked trace, provided traces are being sampled.
Machine Learning with Exemplars
The multimodal nature of exemplars—linking metrics, traces, and logs—presents a rich opportunity for machine learning.
- Labeled Anomaly Detection: Unlike traditional anomaly detection, which often relies on unsupervised methods due to a lack of labeled data, exemplars inherently mark specific outliers. This provides a direct source of labeled data, enabling the training of more accurate supervised anomaly detection models.
- Root Cause Analysis and Recommendations: By having linked metrics, traces, and logs, ML models can correlate patterns across these data streams to provide more precise root cause recommendations.
- Large Language Models (LLMs): The contextual richness of exemplars is particularly suited for LLMs. Instead of feeding an LLM vast, unstructured quantities of individual logs, traces, and metrics, exemplars provide a highly focused and contextually relevant bundle of information. This enables LLMs to perform tasks like:
- Incident Classification: Categorizing incidents based on the exemplar's attributes and linked data.
- Incident Summarization: Generating concise summaries of incidents, potentially even drafting Root Cause Analysis (RCA) documents automatically.
- Fix Recommendations: By ingesting previous RCAs, runbooks, and other documentation as metadata alongside exemplar data, LLMs can potentially suggest actionable fixes, further reducing MTTR.
Demo / Proof of Concept
▶ Watch: Live demo: Setting up Kubernetes with eBPF (7:30)
Charlie Le presented a compelling live demo showcasing the auto-instrumentation capabilities using eBPF and OpenTelemetry. The demonstration was set up on a local Kubernetes cluster using K Lima for cluster creation and K9S for cluster interaction.
The core of the demo involved deploying a comprehensive observability stack and a target application, all managed via Helmfile. The installed components included:
- SeaweedFS: Used to emulate S3 storage locally, avoiding external network dependencies.
- Bumblebee (BA): The eBPF-based auto-instrumentation project from Grafana, responsible for generating metrics and exemplars.
- Jaeger: The distributed tracing system, used to store and visualize traces.
- OpenTelemetry Collector: Acts as a central agent to receive, process, and export OpenTelemetry-native metrics and traces to various backends.
- Prometheus: The time-series monitoring system, configured to store metrics along with their exemplar data.
- Grafana: The popular open-source analytics and visualization platform, used to display dashboards with metrics and exemplars, and to link directly to Jaeger traces.
- Cortex: A horizontally scalable, highly available, multi-tenant Prometheus implementation, used as the uninstrumented target application. Charlie, being a maintainer for Cortex, highlighted how this complex microservices setup could be entirely auto-instrumented without any manual code changes.
The demonstration flow unfolded as follows:
- Cluster Setup: A local Kubernetes cluster was initialized, and the observability components along with Cortex were deployed using Helmfile.
- Grafana Dashboard: Charlie port-forwarded the local Grafana instance and navigated to a pre-configured "exemplars dashboard."
- Cortex Ingestion Side: The dashboard displayed metrics from Cortex's
distributorservice, which typically handles incoming metrics. These metrics, includingpostrequest methods, status codes, and HTTP routes, were being generated by BA. Crucially, Charlie emphasized that the Cortex binary itself was untouched. - Jumping from Metric to Trace: On a latency metric graph for an RPC client request (e.g., 5 milliseconds in a 10-millisecond bucket), an exemplar was visible as a yellow dot. Charlie clicked this exemplar, which immediately revealed its attributes (service name
distributortalking toingestor, latency value, RPC method). A "View in Jaeger UI" button allowed a direct jump to the corresponding distributed trace in Jaeger, showing the full span details and attributes related to that specific RPC call. This vividly illustrated the seamless link from a high-level metric anomaly to its detailed root cause context. - Cortex Query Side: The demo then shifted to Cortex's query path. Charlie executed a deliberately expensive query to generate load. Again, on the Grafana dashboard, exemplars appeared on metrics related to query processing (e.g.,
query_range_request). Clicking these exemplars allowed another jump to Jaeger, showcasing traces for the query front-end's performance. - Meta-Instrumentation: A particularly impressive point was that even Grafana itself, which was querying Cortex, was being auto-instrumented by BA. This "meta-level" demonstration showed the pervasive reach of eBPF-based auto-instrumentation.
The demo successfully validated the core concept: eBPF-powered agents like BA can listen to kernel-level network events, translate them into OpenTelemetry signals, generate trace and span IDs, and inject these into metrics as exemplars. These exemplars, stored in Prometheus and linked to traces in Jaeger, provide an immediate, contextual jump from metric anomalies to detailed trace information, all without requiring any manual application code changes.
Defensive Implications
▶ Watch: Key components used in the demo setup (8:00)
The insights and technologies presented in this talk offer profound defensive implications for any organization managing complex, distributed systems. By adopting eBPF-driven auto-instrumentation for exemplars, defenders can significantly enhance their capabilities in several critical areas:
- Accelerated Incident Response and MTTR Reduction: The most direct benefit is the ability to drastically reduce Mean Time To Resolution (MTTR). When an alert fires based on a metric anomaly, engineers can instantly jump from the high-level metric to the exact distributed trace that caused the outlier. This eliminates hours of manual correlation and sifting through logs/traces, allowing teams to pinpoint the root cause in seconds or minutes rather than hours. This precision debugging is invaluable during critical incidents.
- Enhanced Visibility into Black-Box and Legacy Systems: Many organizations struggle with monitoring third-party applications, commercial off-the-shelf (COTS) software, or legacy services where code modification is impossible or impractical. eBPF's kernel-level instrumentation provides "white-box" visibility into these "black-box" systems. Defenders can gain crucial insights into network interactions, syscalls, and performance characteristics without touching the application code, making it easier to identify and troubleshoot issues in otherwise opaque components.
- Proactive Outlier Detection and Prevention: Exemplars are designed to highlight individual data points that deviate from the norm, even if those deviations are momentary and might be smoothed out by traditional metric aggregations. This allows defenders to catch subtle, transient anomalies that could be precursors to larger issues or indicators of sophisticated attacks. By identifying these outliers early, teams can investigate and potentially prevent incidents before they escalate.
- Context-Rich Security Investigations: When a security event occurs, having immediate access to the full context—the specific metric, the associated trace of the malicious request, and relevant log entries—is paramount. Exemplars provide this rich, linked data, enabling security teams to quickly understand the scope of an attack, identify affected services, and trace the propagation path, aiding in faster containment and remediation. The detailed attributes within an exemplar (e.g., HTTP route, status code, RPC method) can offer immediate clues for investigation.
- Improved Observability for Kubernetes Environments: The deep integration of eBPF with the Linux kernel makes it a natural fit for Kubernetes. Deploying eBPF agents like Bumblebee within a Kubernetes cluster provides immediate, comprehensive observability across all pods and services, without requiring developers to embed instrumentation libraries into their container images. This simplifies the observability stack and ensures consistent data collection across heterogeneous microservices.
- Leveraging Machine Learning for Advanced Threat Detection: The labeled anomaly data provided by exemplars, coupled with the multimodal analysis capabilities (metrics, traces, logs), creates a powerful foundation for machine learning-driven security. Defenders can train supervised ML models to detect specific types of anomalies or attack patterns with higher accuracy. Furthermore, integrating LLMs with exemplar data can automate incident classification, summarization, and even suggest defensive actions or playbooks, further empowering security operations centers (SOCs).
While the benefits are substantial, defenders must also be mindful of potential pitfalls, such as cardinality explosion if overly granular attributes (like uncontrolled HTTP paths) are included in exemplars. Careful configuration and filtering of attributes are necessary to prevent excessive resource consumption in monitoring backends. However, with thoughtful implementation, eBPF and exemplars offer a robust path to a more resilient and observable infrastructure.
Key Takeaways
- Exemplars Bridge the Observability Gap: Exemplars directly link high-level metrics to specific distributed traces and logs via trace and span IDs, eliminating manual correlation and enabling precision debugging.
- eBPF Enables Zero-Code Auto-Instrumentation: eBPF allows for high-resolution, low-overhead collection of telemetry (including exemplars) at the kernel level, without modifying application code, making it ideal for black-box or legacy systems.
- OpenTelemetry Standardizes Telemetry: eBPF-generated data is translated into OpenTelemetry signals, ensuring interoperability with various observability backends like Prometheus (metrics + exemplars) and Jaeger (traces).
- Outlier Highlighting and Context-Rich Data: Exemplars effectively highlight momentary metric outliers that aggregation might hide, providing rich contextual attributes for faster incident understanding.
- Significant MTTR Reduction: The direct jump from metric anomaly to trace context dramatically speeds up root cause analysis, leading to faster incident response and reduced Mean Time To Resolution.
- ML Supercharges Observability: Exemplars provide labeled data for accurate supervised anomaly detection and enable powerful multimodal analysis with Large Language Models for automated incident classification, summarization, and even fix recommendations.
About the Speaker(s)
Kruthika Prasanna Simha is a Machine Learning Engineer at Apple, where she has been for about six years. Her expertise spans observability, machine learning, and data science, focusing on how these fields intersect to enhance system understanding and performance.
Charlie Le is a Software Engineer at Apple, with a tenure of about 8.5 years. His background includes roles in Site Reliability Engineering (SRE), DevOps, and observability. In addition to his work at Apple, Charlie is also a maintainer for Cortex, a prominent project within the Cloud Native Computing Foundation (CNCF), underscoring his deep involvement in the open-source cloud-native ecosystem.
Reviews
Dr. Zero (Offensive Security Researcher) — MUST SEE
This talk presents a genuinely transformative approach to distributed system observability by leveraging eBPF for zero-code auto-instrumentation of exemplars, seamlessly linking high-level metrics to detailed traces and logs via OpenTelemetry. The speakers demonstrate a practical, impactful solution that drastically reduces Mean Time To Resolution (MTTR) by enabling precision debugging, offering unprecedented visibility into black-box systems, and laying a robust foundation for advanced machine learning applications in incident management. This is a critical development for anyone serious about operating complex infrastructure.
Heather Calloway (CISO) — STRONG ACCEPT
This session on leveraging eBPF and OpenTelemetry for auto-instrumenting exemplars presents a highly impactful solution for modern observability challenges. By directly linking metrics to detailed traces and logs, it offers a credible path to drastically reduce Mean Time To Resolution (MTTR) and provides critical visibility into previously opaque systems. While not explicitly a governance talk, its operational implications for incident response, proactive threat detection, and security investigations are profound, offering security leaders and their teams actionable strategies to enhance resilience and risk posture.