How Green Is My OpenTelemetry Collector? - Nancy Chauhan, Student & Adriana Villela, Dynatrace
Nancy Chauhan, Student, Adriana Villela, Dynatrace
KubeCon + CloudNativeCon Europe 2025 · Session
Overview
In an era where the environmental impact of technology is under increasing scrutiny, the talk "How Green Is My OpenTelemetry Collector?" presented by Adriana Villela and Nancy Chauhan at KubeCon EU, delves into a critical, yet often overlooked, aspect of cloud-native operations: the energy consumption of observability tools. Specifically, this presentation focuses on the OpenTelemetry Collector, a pivotal component in modern observability stacks responsible for ingesting, processing, and exporting telemetry data. The speakers highlight that while OpenTelemetry is indispensable for understanding application and infrastructure health, its operation—from data emission to ingestion and storage—consumes significant computational resources, thereby contributing to the IT sector's growing carbon footprint.
Key moments
- 0:00 Introduction, speakers, and talk's enthusiastic welcome
- 1:50 IT sector's staggering global carbon emission statistics
- 2:35 The core problem: Making OpenTelemetry Collector greener
- 3:00 Overview of the observability setup and components
- 4:10 How OpenTelemetry Operator manages collectors and metrics
- 6:05 Introducing Kepler: its purpose, technology, and benefits
- 7:45 Prerequisites for installing Kepler in a Kubernetes environment
How Green Is My OpenTelemetry Collector?
Speakers: Nancy Chauhan, Student; Adriana Villela, Dynatrace
Conference: KubeCon EU
YouTube: https://www.youtube.com/watch?v=ea2CKLX5vEs
Overview
In an era where the environmental impact of technology is under increasing scrutiny, the talk "How Green Is My OpenTelemetry Collector?" presented by Adriana Villela and Nancy Chauhan at KubeCon EU, delves into a critical, yet often overlooked, aspect of cloud-native operations: the energy consumption of observability tools. Specifically, this presentation focuses on the OpenTelemetry Collector, a pivotal component in modern observability stacks responsible for ingesting, processing, and exporting telemetry data. The speakers highlight that while OpenTelemetry is indispensable for understanding application and infrastructure health, its operation—from data emission to ingestion and storage—consumes significant computational resources, thereby contributing to the IT sector's growing carbon footprint.
The core premise of the talk is that to make any system greener, one must first measure its environmental impact, then experiment with optimizations, and finally mitigate the identified issues. Villela and Chauhan demonstrate a practical methodology for assessing and reducing the energy consumption of an OpenTelemetry Collector deployed within a Kubernetes environment. By leveraging tools like Kepler (Kubernetes-based Efficient Power Level Exporter) to gather energy metrics and the OpenTelemetry Operator for collector management, they conduct experiments to identify configuration and architectural changes that can lead to more energy-efficient telemetry pipelines.
This talk is particularly significant for anyone involved in cloud-native development, DevOps, or SRE roles, as it bridges the gap between operational efficiency and environmental sustainability. It provides a blueprint for how organizations can proactively analyze and optimize their observability infrastructure to reduce carbon emissions, directly addressing the broader challenge of making the IT industry more environmentally responsible. The findings underscore that "greener" practices are not just an ethical imperative but can also lead to more cost-effective and resource-efficient systems.
Background
▶ Watch: Introduction, speakers, and talk's enthusiastic welcome (0:00)
The global IT sector is a substantial contributor to carbon emissions, currently accounting for approximately 2% of worldwide emissions. Projections indicate a concerning rise to 12% by 2040, a staggering increase that necessitates immediate and widespread adoption of greener practices. While public cloud migration can offer significant reductions in carbon emissions (up to 84% according to a 2020 Accenture report), the sheer scale of cloud infrastructure and the continuous operation of applications and services still present considerable environmental challenges.
OpenTelemetry, as a vendor-neutral observability framework, plays a crucial role in collecting vital telemetry data (traces, metrics, logs) from applications and infrastructure. However, the very act of emitting, collecting, processing, and ingesting this data consumes CPU, memory, and network resources. Whether telemetry is processed by a Software-as-a-Service (SaaS) vendor, a homegrown solution on public cloud, or a private cloud deployment, these operations collectively contribute to the IT sector's energy footprint. The OpenTelemetry Collector, in particular, stands as a central component in this process, making its efficiency a key target for sustainability efforts.
The speakers emphasize a fundamental principle: "to take an action, we first need to measure something." This underpins their approach to making the OpenTelemetry Collector "greener." Prior work in this domain has often focused on broader data center efficiency or application-level optimizations. However, the specific energy consumption of observability components like the OpenTelemetry Collector has received less attention. This talk aims to fill that gap by providing a concrete methodology and experimental results for optimizing this critical piece of the cloud-native puzzle. The problem exists because, without explicit measurement and optimization, observability tools, while enabling better system understanding, inadvertently become part of the environmental challenge.
Key Findings
▶ Watch: The core problem: Making OpenTelemetry Collector greener (2:35)
The talk presented two primary experiments designed to evaluate the energy and memory consumption of the OpenTelemetry Collector under different configurations, yielding distinct and insightful findings:
- Splitting the Collector Configuration (Application vs. Kepler Pipelines):
- Hypothesis: Separating application telemetry pipelines from Kepler/Kubernetes infrastructure pipelines into two distinct OpenTelemetry Collector instances might lead to better resource utilization and lower overall consumption.
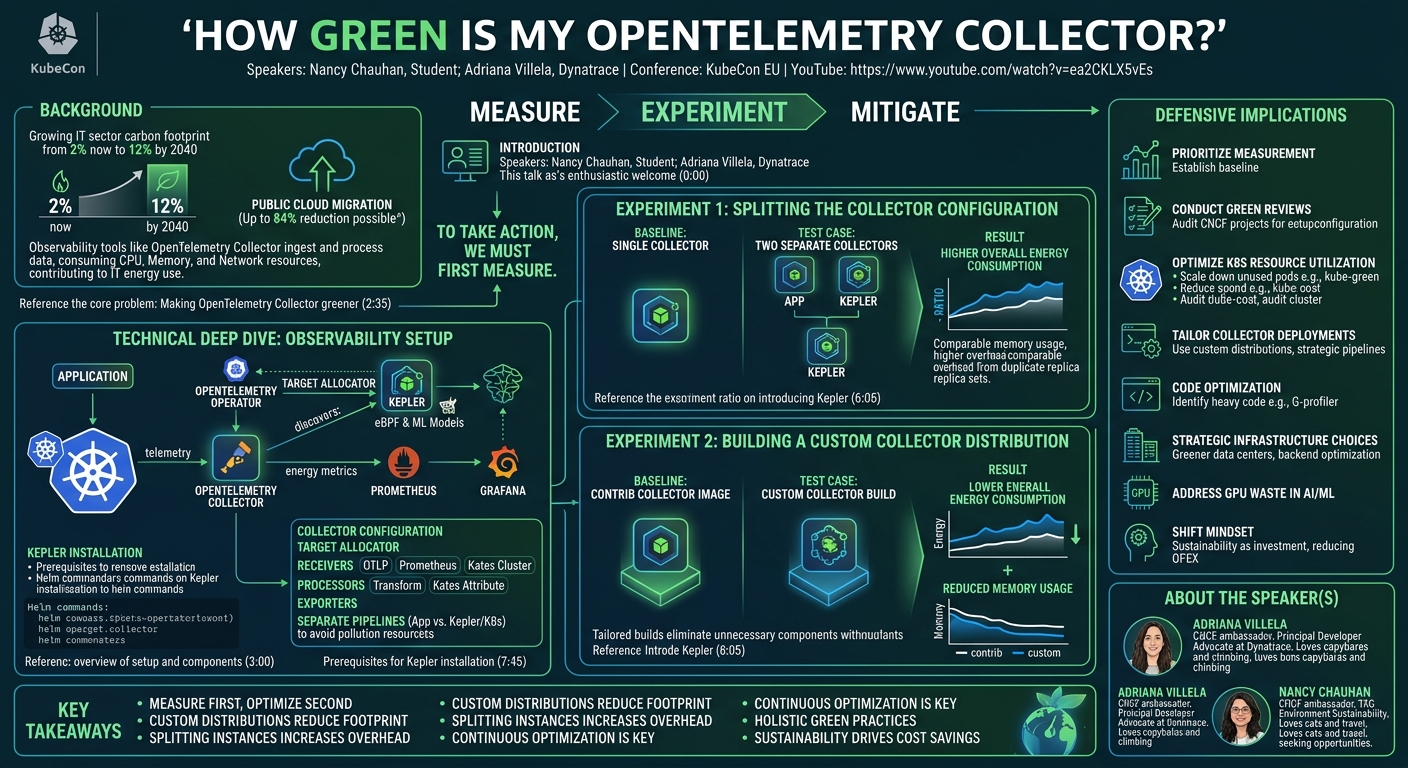
- Result: Counter-intuitively, running two separate collector instances (one for application telemetry, one for Kepler/Kubernetes telemetry) resulted in higher overall energy consumption and comparable memory usage compared to a single collector instance handling both pipelines. The visual representation showed that while individual split collectors used less energy, their combined consumption (represented by the blue line) surpassed that of the single baseline collector (white line). The calculated ratio of energy consumption was negative, indicating a worse performance. This outcome was attributed to the overhead of running two replica sets of the collector, demonstrating that architectural separation doesn't always translate to efficiency gains if it means duplicating core processes and increasing overall resource footprint.
- Building a Custom Collector Distribution:
- Hypothesis: Creating a custom OpenTelemetry Collector distribution, including only the necessary receivers, processors, and exporters, rather than using the full contrib image, would reduce resource consumption.
- Result: This experiment showed significant positive improvements. The custom collector distribution consistently demonstrated lower energy consumption and reduced memory usage compared to the baseline contrib collector image. The energy consumption ratio was positive, indicating an improvement. Specifically, the custom collector (blue line) fared better than the contrib collector (white line) in terms of energy output, and its memory consumption was notably lower. This finding strongly advocates for tailoring collector builds to specific needs, eliminating unnecessary components that contribute to overhead.
Beyond these specific experimental results, the speakers distilled several crucial lessons for anyone undertaking similar optimization efforts:
- Iterative Tuning: Optimization is an ongoing process, akin to software development, and is never truly "done." Continuous tuning and experimentation are required.
- Controlled Experimentation: When running tests, it's vital to change only one variable at a time against a consistent baseline. This allows for accurate attribution of impacts.
- Multiple Tests and Consistent Infrastructure: Relying on a single test can be misleading. Subsequent tests might reveal different outcomes (e.g., initial custom collector tests showed lower energy, but later tests sometimes showed it as worse). Testing on the same Kubernetes cluster, region, and cloud provider minimizes external variables.
- Learning Curve: Be prepared for a significant learning curve involving tools like Kepler, the OpenTelemetry Operator, complex collector configurations, Prometheus, and dashboarding solutions like Grafana.
- No Quick Fixes: Achieving significant green optimization requires sustained effort and a holistic approach; simply adopting a tool like Kepler does not automatically guarantee an optimized environment.
These findings collectively underscore that while the intent to "go green" is laudable, practical implementation requires meticulous measurement, thoughtful experimentation, and an understanding that efficiency gains are often found in the details of component selection and configuration, not just in broad architectural shifts.
Technical Deep Dive
▶ Watch: Overview of the observability setup and components (3:00)
The talk outlines a comprehensive technical setup for measuring and optimizing the energy consumption of an OpenTelemetry Collector within a Kubernetes environment. The architecture is built around several key CNCF projects and components:
The Cast of Characters in this setup includes:
- An application deployed in Kubernetes.
- The OpenTelemetry Collector for ingesting application and infrastructure telemetry.
- Kepler for energy consumption metrics.
- Kube-Prometheus Stack (Prometheus for storage, Grafana for visualization) or a custom observability backend.
The core principle is to measure energy consumption, experiment with configurations, and then mitigate inefficiencies.
Kepler (Kubernetes-based Efficient Power Level Exporter)
Kepler is a crucial open-source CNCF project designed to monitor and optimize energy consumption in Kubernetes environments. It leverages eBPF (extended Berkeley Packet Filter) technology to collect low-level data such as CPU performance counters and Linux kernel trace points. This raw data is then fed into Machine Learning (ML) models which estimate the energy consumption of various Kubernetes components, including pods and nodes. Kepler exports these energy metrics in Prometheus metric format, making them easily consumable by standard observability backends.
Installation of Kepler:
- Prerequisites: Kubernetes cluster, Helm, Prometheus or any Prometheus-compatible backend, and the OpenTelemetry Operator.
- Helm Installation: Kepler is installed via Helm. The speakers demonstrated enabling the ServiceMonitor (for Prometheus discovery) and process metrics (for detailed container process information).
- ServiceMonitor Configuration: A ServiceMonitor custom resource is deployed to instruct Prometheus (or the Target Allocator) on how to scrape metrics from Kepler. This configuration also includes dropping certain metrics to prevent overload, demonstrating a practical approach to managing observability data volume.
- Grafana Dashboard: An optional Grafana dashboard specifically designed for Kepler metrics is installed to visualize the energy consumption data.
OpenTelemetry Operator and Collector Configuration
The OpenTelemetry Operator is a Kubernetes operator that simplifies the management and configuration of OpenTelemetry Collectors. It allows users to define collector instances using a Custom Resource (CR) called OpenTelemetryCollector.
Key configuration points for the OpenTelemetryCollector CR:
- Target Allocator: This component of the OpenTelemetry Operator is essential for discovering Prometheus scrape targets.
- It must be explicitly enabled (
targetAllocator.enabled: true) as it's disabled by default. - Prometheus CR discovery (
targetAllocator.prometheusCR.enabled: true) is also enabled. This allows the Target Allocator to discover standard Prometheus operator CRs like PodMonitor and ServiceMonitor, which are used to define scrape targets for Kepler and other services. The Target Allocator then dynamically adds these scrape jobs to the OpenTelemetry Collector's Prometheus receiver configuration.
- Receivers: The collector is configured to ingest various types of telemetry:
- OTLP Receiver: For receiving application telemetry (traces, metrics, logs) from instrumented applications.
- Prometheus Receiver: Crucial for ingesting the Kepler metrics, which are exported in Prometheus format.
- Kate's Cluster Receiver: Gathers cluster-level telemetry by interacting with the Kubernetes API server.
- Kubelet Stats Receiver: Collects node, pod, container, and volume level telemetry directly from the Kubelet API.
- Processors: After ingestion, telemetry data undergoes processing:
- Transform Processor: Used to rename metrics received from Kepler. Specifically, it converts the Prometheus-style underscore notation (e.g.,
kepler_container_joules_total) to the OpenTelemetry standard dot notation (e.g.,kepler.container.joules.total). - Kate's Attribute Processor: Enriches telemetry data with additional Kubernetes metadata (e.g., pod names, namespace, labels). The talk highlights using two instances of this processor for different metric pipelines, with one enriching slightly less for a specific pipeline.
- Resource Processor: Adds common resource attributes, such as the cluster name, to the telemetry data.
- Exporters: While not detailed in the talk (assuming familiarity with exporting to an observability backend), the collector would typically export processed data to a chosen backend (e.g., an OpenTelemetry-compatible SaaS, Prometheus, or another system).
- Service Definition and Pipelines: The talk emphasizes the importance of defining clear pipelines within the collector's service definition:
- Application Pipeline: Handles traces, metrics, and logs originating from applications.
- Kepler/Kubernetes Pipeline: Specifically for ingesting Prometheus-formatted Kepler data and other Kubernetes infrastructure metrics.
- Separation Rationale: The speakers stress that maintaining two separate sets of pipelines is critical to avoid "polluting" the application pipeline with infrastructure-specific Kepler data. This ensures cleaner data separation and potentially more efficient processing paths for different data types.
This technical architecture provides the foundation for collecting comprehensive energy consumption data alongside operational telemetry, enabling detailed analysis and optimization experiments.
Demo / Proof of Concept
▶ Watch: Introducing Kepler: its purpose, technology, and benefits (6:05)
The practical demonstration outlined in the talk focuses on setting up the described Kubernetes-based observability environment and conducting two key experiments to measure the OpenTelemetry Collector's energy efficiency.
Setup Steps:
- Kubernetes Cluster: A standard Kubernetes cluster is required as the foundation.
- Helm: Used for simplified installation of various components.
- Kube-Prometheus Stack (Optional): While optional if a custom observability backend is used, the demo environment includes installing Prometheus for metric storage and Grafana for visualization. This involves:
- Waiting for Prometheus pods to be ready.
- Retrieving Grafana pod names.
- Installing a pre-configured Grafana dashboard JSON specifically for Kepler metrics.
- Kepler Installation:
- Adding the Kepler Helm repository.
- Installing Kepler into its own namespace (e.g.,
kepler). - Enabling the ServiceMonitor for Prometheus discovery.
- Enabling process metrics for granular container process data.
- Configuring a Kepler ServiceMonitor to define Prometheus scrape configurations, including dropping specific metrics to prevent data overload.
- OpenTelemetry Operator Installation:
- Installing the cert-manager (a prerequisite for the OTel Operator).
- Installing the OpenTelemetry Operator itself.
- OpenTelemetry Collector Configuration: The custom
OpenTelemetryCollectorCR is applied, incorporating the detailed receiver, processor, and pipeline configurations described in the technical deep dive. This includes enabling the Target Allocator and its Prometheus CR discovery feature.
Experimental Design:
The demo then proceeds to execute two distinct experiments, each designed to isolate a specific optimization strategy and measure its impact:
- Experiment 1: Splitting Collector Instances:
- Baseline: A single OpenTelemetry Collector instance using the standard
contribimage, configured with a singleOpenTelemetryCollectorCR that defines both the application telemetry pipeline and the Kepler/Kubernetes infrastructure pipeline. - Test Case: Two separate
OpenTelemetryCollectorinstances are deployed. One instance exclusively handles the application telemetry pipeline, and the other handles only the Kepler/Kubernetes infrastructure pipeline. Both instances still use thecontribimage. - Measurement: The key metrics observed are Kepler container_joules_total (converted to kilowatt-hours) and the OpenTelemetry Collector's own memory consumption metrics. The energy consumption of the two split collectors is then combined and compared against the single baseline collector. A ratio of energy consumption is calculated: (new configuration - baseline) / baseline. A positive ratio indicates improvement, while a negative ratio indicates worse performance.
- Experiment 2: Custom Collector Distribution:
- Baseline: The same single OpenTelemetry Collector instance using the
contribimage from Experiment 1. - Test Case: A single OpenTelemetry Collector instance is deployed, but instead of the
contribimage, it uses a custom-built collector distribution. This custom image is compiled to include only the exact receivers, processors, and exporters specified in the collector's configuration, excluding any unnecessary components found in the largercontribimage. It maintains the single, combined pipeline structure. - Measurement: Similar to Experiment 1, Kepler container_joules_total (converted to kWh), the energy consumption ratio, and the collector's memory consumption metrics are used for comparison against the baseline
contribcollector.
The results are then visualized using Grafana, allowing for a clear comparison of energy output and memory usage over time between the baseline and experimental configurations. The talk specifically highlights graphs showing the energy output (joules/kWh) and memory usage (bytes) for each test, demonstrating that while splitting pipelines into separate collectors increased overhead, building a custom collector distribution led to measurable reductions in both energy and memory footprint. The consistent observation of the contrib collector using more memory than the custom collector was a particularly strong finding.
Defensive Implications
▶ Watch: Prerequisites for installing Kepler in a Kubernetes environment (7:45)
The insights from "How Green Is My OpenTelemetry Collector?" offer crucial guidance for defenders and platform engineers aiming to build more sustainable and efficient cloud-native environments. The defensive implications extend beyond just environmental impact, often correlating directly with cost savings and operational resilience.
- Prioritize Measurement: The fundamental takeaway is that "you need measurements." Defenders must first establish a baseline of energy consumption for their cloud-native infrastructure, particularly for key components like the OpenTelemetry Collector. Tools like Kepler are indispensable for this, providing granular, Kubernetes-aware energy metrics. Without accurate measurement, optimization efforts are blind.
- Conduct Green Reviews: Incorporate "green reviews" into regular operational audits. Similar to security reviews, these should assess the carbon footprint of CNCF projects and internal applications. The CNCF TAG Environment Sustainability group offers a model for this, encouraging a community-driven approach to identifying and mitigating environmental impacts.
- Optimize Kubernetes Resource Utilization:
- Scale Down Unused Capacity: Regularly audit and scale down or spin down unused Kubernetes pods and services. Tools like kube-green can automate the spinning down of unused Kubernetes pods, directly reducing energy waste.
- Monitor and Reduce Spend: Leverage tools like kube-cost to monitor and reduce Kubernetes infrastructure spend. Often, reducing infrastructure cost goes hand-in-hand with reducing carbon emissions.
- Clean Up and Audit: Implement processes to regularly clean up unused services and audit everything running in the cluster to eliminate zombie resources or over-provisioned components.
- Tailor OpenTelemetry Collector Deployments:
- Custom Collector Distributions: As demonstrated in the talk, building custom OpenTelemetry Collector distributions that include only the absolutely necessary receivers, processors, and exporters significantly reduces memory footprint and energy consumption. This minimizes the overhead of unused components present in larger
contribimages. - Strategic Pipeline Design: Carefully design collector pipelines. While separating application and infrastructure pipelines might seem logical, avoid the overhead of multiple collector instances if a single, well-configured instance can efficiently handle segregated data paths.
- Code Optimization for Energy Efficiency:
- Identify Heavy Code: Actively identify and refactor application code that generates heavy CPU cycles and excessive memory allocation. Tools like G-profiler can help pinpoint such hotspots.
- Reduce Data Pollution: Minimize unnecessary telemetry data. While comprehensive observability is good, "noisy" or redundant data consumes resources across the entire pipeline.
- Strategic Infrastructure Choices:
- Greener Data Centers: Where possible, choose cloud providers and regions known for their use of renewable energy and efficient data center designs (e.g., the mention of Sweden as a green data center location).
- Backend Optimization: If your observability backend supports direct metric ingestion, consider "ditching the Kube-Prometheus stack" to reduce redundant components and associated overhead, leveraging existing infrastructure more efficiently.
- Address GPU Waste in AI/ML: For organizations heavily invested in AI/ML, GPU waste is a major energy leak. Experts like Yusin Farmer highlight that most teams use only 20-30% of their GPUs. Optimizing AI pipelines for efficiency, from agentic job levels at inference time compute to future AGI breakthroughs, is critical.
- Shift Mindset: Sustainability as an Investment: Frame carbon footprint reduction not as a sunk cost, but as an opportunity to reduce operational expenses. Efficient systems consume less energy, require less hardware, and incur lower cloud bills. This provides a strong business case for investing in green initiatives.
By integrating these defensive strategies, organizations can proactively manage their environmental impact, enhance operational efficiency, and build more resilient and cost-effective cloud-native platforms.
Key Takeaways
- Measure First, Optimize Second: Effective "greening" of IT infrastructure, including the OpenTelemetry Collector, critically depends on first measuring energy consumption using tools like Kepler and eBPF.
- Custom Collector Distributions Reduce Footprint: Building a custom OpenTelemetry Collector distribution with only essential components significantly lowers both memory usage and energy consumption compared to using generic
contribimages. - Separating Collector Instances Can Increase Overhead: While logical, splitting OpenTelemetry Collector pipelines into separate instances (e.g., for application vs. infrastructure) can increase overall energy and memory consumption due to the overhead of running multiple replica sets.
- Continuous Optimization is Key: Environmental sustainability is an ongoing process; regularly tune, experiment, and audit your configurations and code, as optimization is never truly "done."
- Beyond the Collector: Holistic Green Practices: Extend green efforts to broader Kubernetes resource management (e.g.,
kube-green,kube-cost), code optimization (e.g.,G-profiler), greener data center choices, and addressing GPU waste in AI/ML. - Sustainability Drives Cost Savings: Reducing carbon footprints is not just an ethical imperative but also a practical strategy for reducing infrastructure expenses and improving operational efficiency.
About the Speaker(s)
Adriana Villela is a CNCF ambassador, blogger, podcaster, and a maintainer of the OpenTelemetry End User SIG. By day, she serves as a Principal Developer Advocate at Dynatrace, dedicating most of her time to OpenTelemetry and observability. Outside of work, Adriana enjoys climbing walls, bouldering, and has a fondness for capybaras. She is the host of the "Geeking Out" podcast, where she interviews prominent figures in the cloud-native and observability space, and has authored an O'Reilly video course on observability with OpenTelemetry.
Nancy Chauhan is a CNCF ambassador and co-chair for advocacy in the TAG Environment Sustainability. She has a background as a DevOps engineer and developer advocate, with experience in open-source contributions. Nancy is passionate about cats and travel. She founded the Women in Cloud Native community in December 2022 and actively promotes diversity and inclusion within the cloud-native ecosystem. Nancy is currently looking for new job opportunities in cool projects.
Reviews
Dr. Zero (Offensive Security Researcher) — STRONG ACCEPT
This talk by Villela and Chauhan tackles a critical, often-ignored aspect of cloud-native operations: the energy consumption of observability tools, specifically the OpenTelemetry Collector. Leveraging tools like Kepler and eBPF, they provide a practical methodology and concrete experimental results on how to measure and reduce the carbon footprint of telemetry pipelines. The findings, particularly the counter-intuitive overhead of splitting collector instances versus the significant gains from custom collector builds, offer actionable insights for any SRE or platform engineer looking to build more sustainable and cost-efficient systems.
Heather Calloway (CISO) — STRONG ACCEPT
This KubeCon talk meticulously addresses the critical, yet often overlooked, energy consumption of OpenTelemetry Collectors, providing a robust methodology to measure, experiment with, and mitigate the environmental and financial costs of observability. While primarily technical, its findings offer direct implications for cloud cost optimization, operational efficiency, and emerging ESG governance, making it highly relevant for executive leaders focused on institutional resilience and resource stewardship. The actionable insights, particularly around custom collector builds, offer a clear path for platform teams to reduce their cloud footprint and associated expenses.