Project Lightning Talk: Quick Intro to CI/CD Observability with OpenTelemetry - Dotan Horovits
Dotan Horovits
KubeCon + CloudNativeCon Europe 2025 · Project Lightning Talk
Overview
In this insightful lightning talk at KubeCon Europe 2025, Dotan Horovits, a long-standing advocate for robust software delivery insights, introduced the critical advancements in CI/CD observability leveraging OpenTelemetry (OTEL). The presentation highlighted a significant shift in how we perceive and implement observability, extending its traditional focus from production systems to encompass the entire Software Development Life Cycle (SDLC). This initiative aims to illuminate the often-opaque processes within continuous integration and continuous delivery pipelines, providing unparalleled visibility into build, test, and deployment phases.
Key moments
- 0:00 Introduction to CI/CD Observability and OpenTelemetry SIG
- 1:15 Understanding OpenTelemetry semantic conventions definition
- 1:50 Key attributes for CI/CD pipelines and runs
- 2:00 Semantic conventions for deployments, VCS, tests, artifacts
- 2:55 Deriving and visualizing CI/CD metrics and traces
- 3:50 OpenTelemetry context propagation using environment variables
- 4:30 OpenTelemetry CI/CD integrations and future directions
- 5:05 Learn more: KubeCon talk and blog post
Project Lightning Talk: Quick Intro to CI/CD Observability with OpenTelemetry - Dotan Horovits
Speakers: Dotan Horovits, OpenTelemetry CI/CD SIG Co-lead
Conference: KubeCon EU
YouTube: https://www.youtube.com/watch?v=vpMHv-56gsk
Overview
In this insightful lightning talk at KubeCon Europe 2025, Dotan Horovits, a long-standing advocate for robust software delivery insights, introduced the critical advancements in CI/CD observability leveraging OpenTelemetry (OTEL). The presentation highlighted a significant shift in how we perceive and implement observability, extending its traditional focus from production systems to encompass the entire Software Development Life Cycle (SDLC). This initiative aims to illuminate the often-opaque processes within continuous integration and continuous delivery pipelines, providing unparalleled visibility into build, test, and deployment phases.
Horovits detailed the collaborative efforts within a new Special Interest Group (SIG) under OpenTelemetry, co-led with Ael Perkins, dedicated to standardizing telemetry for CI/CD. The core of this work revolves around defining semantic conventions—a common language for describing CI/CD-related attributes—and developing novel mechanisms for context propagation in non-networked environments. This undertaking is crucial for organizations seeking to optimize their development workflows, enhance security posture, and ultimately accelerate the delivery of high-quality software by making every stage of the pipeline fully observable and understandable.
The importance of this work cannot be overstated. As software systems grow in complexity and delivery cycles shorten, the ability to rapidly diagnose issues, understand performance bottlenecks, and ensure the integrity of the software supply chain within CI/CD becomes paramount. By bringing standardized observability to these critical stages, the OpenTelemetry CI/CD SIG is empowering developers and operations teams with the data needed to build more resilient, efficient, and secure software delivery pipelines, fundamentally transforming how we monitor and manage the journey of code from commit to production.
Background
▶ Watch: Introduction to CI/CD Observability and OpenTelemetry SIG (0:00)
The journey towards comprehensive CI/CD observability with OpenTelemetry is rooted in a long-standing challenge within the software industry: the disparity between the rich observability available for production environments and the often-limited visibility into the very processes that construct and deploy those systems. Dotan Horovits articulated that he has been discussing and advocating for CI/CD observability for many years across various conferences, including previous KubeCons and CDCONs, underscoring the persistent need for better tools and standards in this domain.
Approximately two years prior to this talk, Horovits took a significant step by raising an OpenTelemetry Enhancement Proposal (OTEP). This proposal was a direct call to action, suggesting that OpenTelemetry—which had become the de facto standard for collecting telemetry data (metrics, traces, logs) primarily from runtime applications—should expand its scope to cover CI/CD observability. The traditional focus of OTEL on production monitoring, often facilitated by network-based context propagation (e.g., HTTP, gRPC), left a substantial gap when it came to understanding the intricate, often sequential, and non-networked operations within build pipelines.
The OTEP successfully garnered support and ultimately led to the formation of a new Special Interest Group (SIG) within the OpenTelemetry project. This SIG, co-led by Dotan Horovits and Ael Perkins, was chartered with the explicit mission of addressing the unique observability requirements of CI/CD systems. Before this initiative, there was no widely accepted, vendor-neutral standard for instrumenting CI/CD pipelines to produce consistent, correlatable telemetry. This lack of standardization meant that insights into pipeline performance, failures, and resource utilization were often fragmented, platform-specific, or required extensive custom instrumentation, hindering effective analysis and optimization. The SIG's formation marked a pivotal moment, laying the groundwork for a unified approach to CI/CD observability that integrates seamlessly with existing OpenTelemetry deployments.
Key Findings
▶ Watch: Key attributes for CI/CD pipelines and runs (1:50)
The OpenTelemetry CI/CD SIG has made several pivotal contributions, primarily focused on establishing a standardized framework for telemetry within the software delivery pipeline. The overarching goal is to enable end-to-end observability across the entire SDLC, from the initial code commit to the final deployment and beyond.
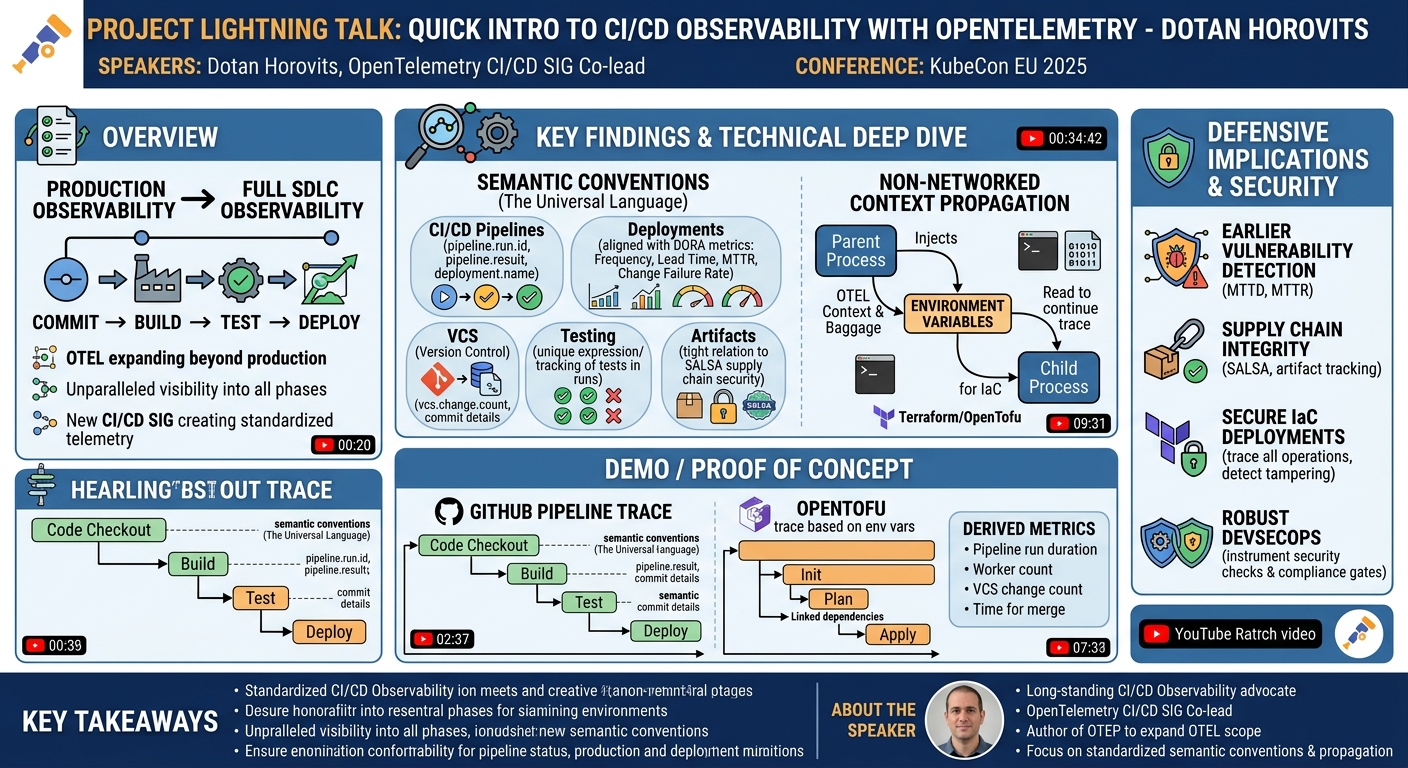
A cornerstone of this effort is the development of semantic conventions for CI/CD. As Horovits explained, semantic conventions are "the common language for describing your telemetry," defining which attributes to report about a system. In the context of CI/CD, these conventions provide a standardized vocabulary for various aspects of the pipeline, ensuring consistency across different tools and platforms. The SIG has tackled several critical domains for these conventions:
- CI/CD Pipelines: Attributes are defined to characterize pipeline runs, including elements like
deployment name,pipeline result, andpipeline run ID. This allows for unique identification and tracking of individual pipeline executions and their outcomes. - Deployments: The conventions aim to express deployments consistently, aligning with industry-recognized metrics such as Dora metrics (e.g., deployment frequency, lead time for changes, mean time to recovery, change failure rate). This standardization facilitates performance measurement and improvement of the deployment process.
- Version Control Systems (VCS): Attributes are defined to capture actions and metadata related to repositories, such as changes made, merge operations, and commit details. This provides crucial context for understanding the source of changes flowing through the pipeline.
- Testing: The conventions address how to uniquely express and track tests within CI/CD pipeline runs, allowing for detailed analysis of test execution, results, and their impact on overall quality.
- Artifacts: Tightly integrating with concepts from Salsa (Supply-chain Levels for Software Artifacts), these conventions provide a standardized way to describe and track software artifacts generated and consumed throughout the pipeline, enhancing supply chain security and traceability.
Beyond semantic conventions, another significant contribution is the specification for context and baggage propagation over environment variables. Traditional OpenTelemetry context propagation relies on network protocols (HTTP, gRPC) to pass trace context between services. However, CI/CD pipelines often involve spawning sub-processes (e.g., shell scripts, build tools, infrastructure as code tools like Terraform or OpenTofu) that do not communicate over a network in the same way. The ability to propagate trace context and baggage via environment variables ensures that the lineage of operations can be maintained and visualized, even across disparate execution environments within a single pipeline run. This is crucial for building comprehensive end-to-end traces that span the entire CI/CD process.
The SIG has also actively worked on deriving relevant metrics, traces, and events (logs) from these attributes. Examples of metrics include pipeline run duration, worker count, VCS change count, and time for merge. Prototype implementations and receivers have been developed for popular CI/CD platforms like GitHub and GitLab, with active interest in extending support to Argo Workflows and Jenkins, demonstrating the practical applicability of these standards. The long-term vision includes expanding semantic conventions to cover additional use cases, such as software outage incidents, further solidifying OpenTelemetry's role across the entire SDLC.
Technical Deep Dive
▶ Watch: Deriving and visualizing CI/CD metrics and traces (2:55)
The technical core of the OpenTelemetry CI/CD SIG's work revolves around two primary pillars: establishing robust semantic conventions and pioneering context propagation mechanisms for non-networked environments. These innovations are fundamental to transforming CI/CD pipelines from black boxes into transparent, observable systems.
Semantic Conventions: The Universal Language for CI/CD Telemetry
As highlighted by Horovits, semantic conventions are not merely formal definitions but rather a "common language" that standardizes the attributes used to describe telemetry data. For CI/CD, this means defining a consistent set of key-value pairs that describe various aspects of pipeline execution, regardless of the underlying CI/CD platform.
Consider the example of a CI/CD pipeline run. Instead of disparate systems reporting "build_id" or "job_uuid", the semantic conventions would define a standardized attribute like pipeline.run.id to uniquely identify an execution. Similarly, the outcome of a pipeline might be captured by pipeline.result with defined values (e.g., "success", "failure", "cancelled"). Other examples mentioned include deployment.name, which ties into deployment-specific attributes, and attributes related to VCS operations, such as vcs.change.count or vcs.commit.id. These conventions ensure that telemetry data from different stages, tools, and platforms can be aggregated, correlated, and analyzed coherently.
This standardization extends to how different signals—metrics, traces, and logs (events)—interrelate. For instance, a trace can visualize the execution flow of a GitHub pipeline run, with each span in the trace annotated by the relevant semantic conventions (e.g., ci.stage.name, ci.job.name). This allows for a granular understanding of the execution path, identifying bottlenecks or failures within specific stages or jobs. From these traces and attributes, meaningful metrics can be derived, such as pipeline.run.duration (total time for a pipeline execution), pipeline.worker.count (resources utilized), or vcs.time_for_merge (a key Dora metric). The consistent use of semantic conventions ensures that these metrics are comparable and interpretable across different pipelines and teams.
Context and Baggage Propagation over Environment Variables
One of the most innovative technical contributions is the solution for propagating context and baggage over environment variables. In traditional distributed systems, OpenTelemetry uses HTTP headers or gRPC metadata to pass trace context (e.g., trace_id, span_id) and baggage (application-specific key-value pairs) between services. This works effectively for networked communication.
However, CI/CD pipelines present a different challenge. A build script might invoke a compiler, which then spawns a test runner, or an Infrastructure as Code (IaC) tool like Terraform or OpenTofu might execute multiple sub-commands or provision resources. These processes often communicate by spawning child processes, relying on file system operations, or through environment variables, rather than direct network calls. Without a mechanism to propagate trace context in these scenarios, the end-to-end trace would break, making it impossible to correlate operations across different steps of a pipeline or within a complex IaC deployment.
The SIG's specification addresses this by defining how trace context and baggage can be serialized into and deserialized from environment variables. When a parent process (e.g., a CI/CD agent or an IaC orchestrator) initiates a child process, it injects the current trace context into predefined environment variables. The child process, upon startup, reads these variables, extracts the context, and uses it to establish its own spans, effectively continuing the trace. This ensures that a single, continuous trace can span the entire execution of a pipeline, from the initial trigger to the final deployment step, even when multiple tools and processes are involved.
Horovits demonstrated the power of this mechanism with a screenshot visualizing an OpenTofu trace. This trace illustrated how individual operations within an IaC deployment, such as applying configuration or creating resources, could be linked together, providing a clear timeline and dependencies. This capability is critical for debugging IaC deployments, understanding their performance, and attributing changes to specific pipeline runs.
The work also encompasses the development of receivers and exporters for various CI/CD platforms. Receivers are components that ingest telemetry data from specific sources. The SIG has developed prototypes for GitHub and GitLab, and there's active interest in creating receivers for other popular platforms like Argo Workflows and Jenkins. This ensures broad compatibility and ease of adoption for organizations using diverse CI/CD tooling. By providing these standardized tools and conventions, the OpenTelemetry CI/CD SIG is building the infrastructure for truly holistic observability across the entire software delivery lifecycle.
Demo / Proof of Concept
▶ Watch: OpenTelemetry context propagation using environment variables (3:50)
While this was a lightning talk, Dotan Horovits effectively used visual aids to demonstrate the practical application of the OpenTelemetry CI/CD SIG's work. The presentation included screenshots that served as compelling proof-of-concept visualizations, illustrating how the newly defined semantic conventions and context propagation mechanisms translate into actionable observability.
One key screenshot presented a GitHub pipeline run visualized as a trace. This visual representation showed how the standardized semantic conventions could be used to instrument and correlate different stages and jobs within a CI/CD pipeline. Each step in the pipeline, from code checkout to testing and deployment, was depicted as a span within a unified trace. This demonstrated the ability to track the flow of execution, identify dependencies, and pinpoint potential bottlenecks or failure points within the GitHub Actions workflow, all based on the common language provided by the semantic conventions. The ability to see the entire pipeline as a single, continuous trace is a significant leap forward from fragmented logs or isolated metrics.
Another crucial demonstration involved an OpenTofu trace, visualized based on the environment variable propagation mechanism. This screenshot highlighted the innovative solution for propagating trace context in non-networked environments. It showed how a complex Infrastructure as Code (IaC) operation, executed by OpenTofu, could be fully traced. Each sub-operation or resource provisioning step within the OpenTofu execution was represented as a span, all linked together by the trace context passed through environment variables. This visualization is particularly powerful for debugging IaC deployments, understanding the sequence of operations, and attributing resource changes back to specific pipeline runs, providing unprecedented visibility into the often-opaque world of infrastructure provisioning.
These visual proofs of concept, though not live demonstrations, clearly articulated the immediate benefits and technical feasibility of the SIG's initiatives. They underscored how OpenTelemetry, with its extended capabilities, can provide a comprehensive, end-to-end view of the software delivery process, from the first line of code to the final infrastructure deployment.
Defensive Implications
▶ Watch: Learn more: KubeCon talk and blog post (5:05)
The work being done by the OpenTelemetry CI/CD SIG has profound defensive implications for software security and operational resilience. By extending standardized observability into the CI/CD pipeline, organizations gain unprecedented visibility into a critical attack surface and a crucial point of control in the software supply chain.
Firstly, enhanced visibility into the CI/CD pipeline enables earlier detection and remediation of security vulnerabilities. Traditionally, security scanning might occur at various stages, but correlating the results and understanding the impact across the entire pipeline can be challenging. With OpenTelemetry, security scan results, dependency analysis reports, and static code analysis findings can all be ingested as part of the pipeline's telemetry. This allows defenders to trace vulnerabilities back to specific commits, pipeline runs, or even individual build steps, accelerating the mean time to detect (MTTD) and mean time to respond (MTTR) for security incidents.
Secondly, the focus on artifact semantic conventions, especially their tight relation to Salsa (Supply-chain Levels for Software Artifacts), directly strengthens software supply chain security. By standardizing how artifacts are described and tracked throughout the pipeline, organizations can achieve better provenance and integrity verification. Defenders can use this information to ensure that only authorized and verified artifacts are promoted to subsequent stages or deployed to production. If an artifact's metadata changes unexpectedly or its origin cannot be verified, the observability data can immediately flag it as a potential tampering attempt or a compliance violation.
Thirdly, the ability to propagate trace context across non-networked processes, such as those in Infrastructure as Code (IaC) tools like Terraform or OpenTofu, is critical for securing infrastructure deployments. An attacker might attempt to inject malicious configurations or alter IaC templates. By tracing every operation within an IaC run, defenders can identify unauthorized changes, understand the blast radius of misconfigurations, and attribute them to the specific pipeline execution or user that initiated them. This provides an audit trail that is difficult to forge and crucial for forensic analysis.
Furthermore, comprehensive CI/CD observability facilitates robust DevSecOps practices. Security checks, policy enforcement, and compliance gates can be instrumented and their outcomes made observable. This means that security teams can monitor the effectiveness of their controls, identify bypass attempts, and ensure that security is truly "shifted left" and integrated into every stage of development. The standardized telemetry also makes it easier to integrate CI/CD data with existing security information and event management (SIEM) systems or security orchestration, automation, and response (SOAR) platforms.
Finally, by making the performance and behavior of the CI/CD system itself observable, defenders can identify potential denial-of-service vectors or resource exhaustion attacks targeting the build infrastructure. Anomalies in pipeline run duration, worker count, or VCS change count could indicate malicious activity or simply operational inefficiencies that need to be addressed. In essence, the OpenTelemetry CI/CD SIG's work provides the foundational data necessary for building a more secure, transparent, and resilient software delivery ecosystem, transforming CI/CD from a potential blind spot into a well-lit and defensible domain.
Key Takeaways
- OpenTelemetry's Scope Expands: OpenTelemetry is extending its reach beyond traditional production monitoring to provide comprehensive observability for the entire CI/CD pipeline and the Software Development Life Cycle (SDLC).
- Semantic Conventions are Key: The OpenTelemetry CI/CD SIG is actively developing semantic conventions to establish a common, standardized language for describing CI/CD-related telemetry attributes across pipelines, deployments, VCS, testing, and artifacts.
- Non-Networked Context Propagation: A significant technical innovation is the specification for context and baggage propagation over environment variables, enabling continuous tracing across non-networked processes within CI/CD and Infrastructure as Code tools like Terraform and OpenTofu.
- End-to-End Visibility: This initiative enables true end-to-end observability, allowing teams to trace code from commit through build, test, and deployment, identifying bottlenecks, failures, and security issues more efficiently.
- Strengthening DevSecOps: By making CI/CD processes observable and standardizing artifact definitions (aligned with Salsa), the work significantly enhances software supply chain security and facilitates more robust DevSecOps practices.
- Practical Implementations Underway: Prototype receivers for platforms like GitHub and GitLab are already in development, demonstrating the practical applicability of these standards and paving the way for broader adoption.
About the Speaker(s)
Dotan Horovits is a prominent figure in the observability and CI/CD communities, known for his long-standing advocacy for bringing comprehensive observability to the software development lifecycle. He has been actively involved in discussions and initiatives around CI/CD observability for many years, presenting at various conferences including KubeCon and CDCON. Horovits is a key contributor to the OpenTelemetry project, serving as a co-lead for the newly formed OpenTelemetry CI/CD Special Interest Group (SIG). His work within the SIG, which originated from an OpenTelemetry Enhancement Proposal (OTEP) he raised, focuses on defining semantic conventions and developing propagation mechanisms to standardize and enable end-to-end observability for continuous integration and continuous delivery pipelines.
Reviews
Dr. Zero (Offensive Security Researcher) — STRONG ACCEPT
Horovits delivers a sharp, no-nonsense introduction to the OpenTelemetry CI/CD SIG's critical work. This isn't just another 'observability' buzzword bingo; it's a concrete, technical effort to standardize telemetry for software delivery pipelines, addressing a long-standing blind spot. The clever solution for context propagation via environment variables is a genuinely novel and necessary technical detail, making this a highly impactful and well-executed lightning talk that should shift how organizations approach supply chain security and DevSecOps.
Heather Calloway (CISO) — STRONG ACCEPT
This lightning talk introduces a critical initiative to bring standardized observability to CI/CD pipelines using OpenTelemetry. It directly addresses a significant blind spot in software supply chain security and operational resilience. By establishing semantic conventions and enabling context propagation across non-networked environments, this work provides the foundational visibility necessary for executive leadership to understand, own, and govern the risks inherent in our software delivery processes, ultimately empowering teams to build more secure and auditable pipelines.