OTel Sucks (But Also Rocks!) - Juraci Paixão Kröhling, OllyGarden & Daniel Dyla, Dynatrace
Juraci Paixão Kröhling, OllyGarden, Daniel Dyla, Dynatrace
KubeCon + CloudNativeCon Europe 2025 · Session
Overview
In a candid and highly engaging presentation at KubeCon EU, Juraci Paixão Kröhling from OligGarden and Daniel Dyla from Dynatrace tackled the complexities and contradictions of OpenTelemetry (OTEL) with a talk provocatively titled "OTel Sucks (But Also Rocks!)." The session aimed to provide a balanced, real-world perspective on the observability framework, acknowledging its significant challenges while celebrating its indispensable contributions to the modern cloud-native ecosystem. Far from a purely critical expose, the talk leveraged a unique format, featuring recorded testimonials from prominent engineers and community members—Adriel Perkins, James Moyesus (Atlassian), Elena Grahovac (Delivery Hero), and Alexander Magno—who shared their firsthand experiences, both positive and negative.
Key moments
- 0:00 Introduction to 'OTel Sucks (But Also Rocks!)'
- 0:40 Understanding OpenTelemetry's vast and complex scope
- 4:50 The 'rough edges' of auto-instrumentation
- 5:50 Auto-instrumentation causing high cardinality and collector overload
- 7:50 Semantic conventions: promise vs. reality, breaking changes
- 9:50 OpenTelemetry Collector: instability in beta versions
OTel Sucks (But Also Rocks!)
Speakers: Juraci Paixão Kröhling, Software Engineer at OligGarden; Daniel Dyla, Software Engineer at Dynatrace
Conference: KubeCon EU
YouTube: https://www.youtube.com/watch?v=QzStkLbA7Qk
Overview
In a candid and highly engaging presentation at KubeCon EU, Juraci Paixão Kröhling from OligGarden and Daniel Dyla from Dynatrace tackled the complexities and contradictions of OpenTelemetry (OTEL) with a talk provocatively titled "OTel Sucks (But Also Rocks!)." The session aimed to provide a balanced, real-world perspective on the observability framework, acknowledging its significant challenges while celebrating its indispensable contributions to the modern cloud-native ecosystem. Far from a purely critical expose, the talk leveraged a unique format, featuring recorded testimonials from prominent engineers and community members—Adriel Perkins, James Moyesus (Atlassian), Elena Grahovac (Delivery Hero), and Alexander Magno—who shared their firsthand experiences, both positive and negative.
The central thesis of the talk revolved around the inherent duality of OpenTelemetry: its immense power and promise are often accompanied by considerable complexity and "rough edges." The speakers, both deeply embedded in the OpenTelemetry project, offered an insider's view into the struggles faced by practitioners in areas like auto-instrumentation, the stability of semantic conventions, and the OpenTelemetry Collector. Simultaneously, they underscored how these very components, when understood and managed effectively, empower organizations to achieve comprehensive, vendor-agnostic observability, fostering a collaborative and innovative community around a shared vision.
This article delves into the detailed technical insights shared during the presentation, exploring the specific pain points and triumphs associated with OpenTelemetry. It aims to provide a thorough analysis of why OTEL can be a source of frustration for engineers, yet simultaneously stands as a cornerstone for modern telemetry, offering a complete framework for instrumenting, generating, collecting, and exporting telemetry data across diverse systems and programming languages. The discussion highlights the critical balance between ease of adoption, standardization, and the ongoing evolutionary nature of a project of OpenTelemetry's scope.
Background
▶ Watch: Introduction to 'OTel Sucks (But Also Rocks!)' (0:00)
OpenTelemetry emerged as a Cloud Native Computing Foundation (CNCF) project with the ambitious goal of creating a single, vendor-agnostic standard for generating, collecting, and exporting telemetry data (traces, metrics, and logs). It unified two precursor projects, OpenTracing and OpenCensus, aiming to address the fragmentation and vendor lock-in that plagued the observability space. At its core, OpenTelemetry is a specification that defines the data formats and protocols for telemetry. Building upon this, it provides APIs (Application Programming Interfaces) and SDKs (Software Development Kits) in numerous programming languages—currently supporting around 13 different languages—to enable developers to instrument their applications.
The problem OpenTelemetry seeks to solve is monumental: how to consistently observe distributed systems built with a polyglot of languages, frameworks, and deployment models, and then deliver that data to any observability backend. Before OTEL, organizations often faced the dilemma of choosing between vendor-specific agents and libraries, leading to silos of observability data and significant effort when switching vendors or integrating different tools. OpenTelemetry offers a standardized approach, theoretically allowing teams to instrument once and export to multiple backends, thereby reducing operational overhead and increasing flexibility.
However, this ambitious scope inherently introduces complexity, which forms the "sucks" part of the talk's title. As Adriel Perkins noted in his testimonial, "OpenTelemetry is already a lot... There is no doubt about how much stuff there is within OpenTelemetry." This "lot" includes not only the core APIs and SDKs but also instrumentation libraries (both manual and automatic), the powerful OpenTelemetry Collector, and a vast set of semantic conventions designed to standardize attribute names and values. Furthermore, advanced features like the OpenTelemetry Transformation Language (OTTL) add another layer of functionality and learning curve. The talk's speakers and contributors emphasize that while this comprehensive nature is a strength, it also creates a steep learning curve and introduces various operational challenges, which are explored in detail throughout the presentation.
Key Findings
▶ Watch: The 'rough edges' of auto-instrumentation (4:50)
The talk meticulously dissects the dual nature of OpenTelemetry, presenting both its frustrating "sucks" aspects and its empowering "rocks" attributes, often using the same components as examples of both.
Where OpenTelemetry "Sucks":
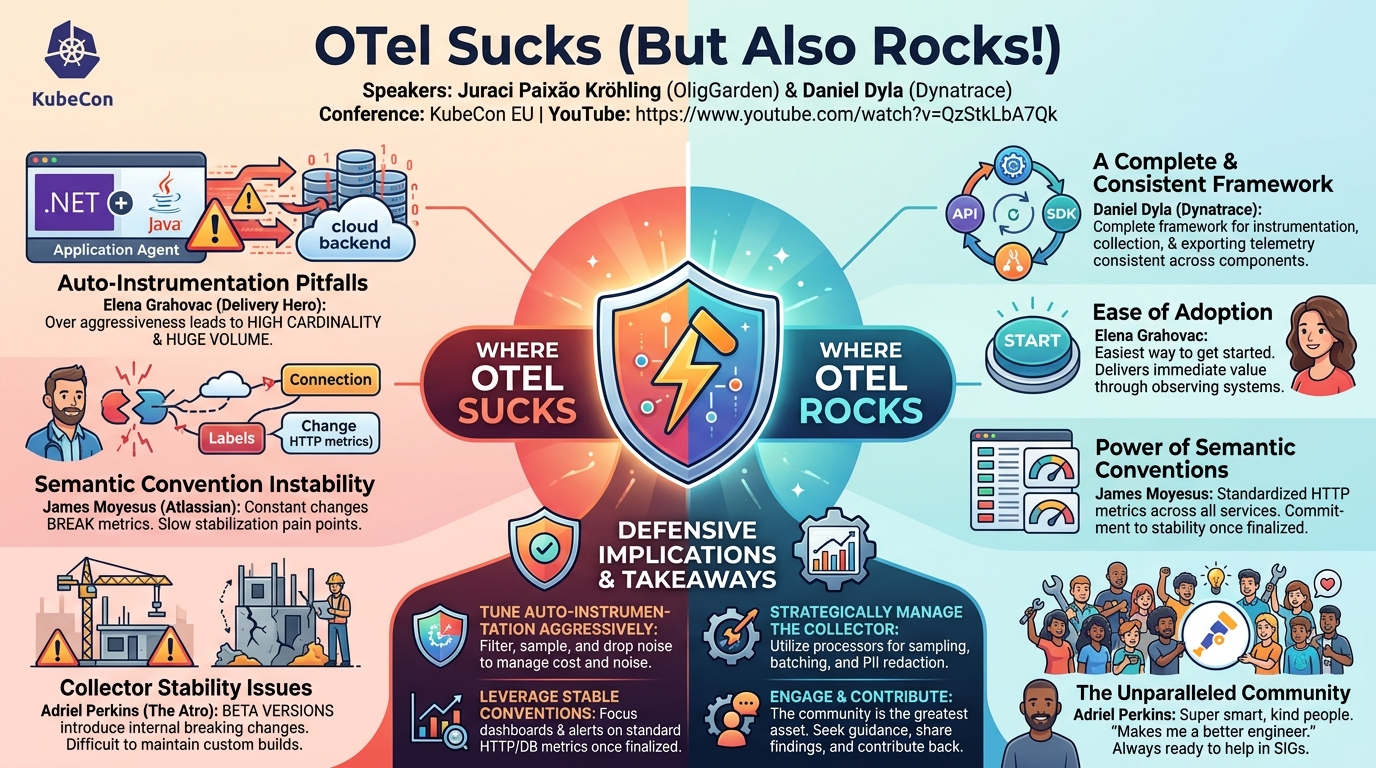
- Auto-Instrumentation Pitfalls: While designed for ease of use, auto-instrumentation can lead to significant operational problems. Elena Grahovac from Delivery Hero highlighted experiences with .NET and Java auto-instrumentation generating telemetry with "extremely high cardinality" and "huge volume." This excessive data overloaded both their OpenTelemetry Collectors and their observability vendor's backend, necessitating extensive tuning. The core issue is that auto-instrumentation often instruments "things that are not necessarily helpful," creating "a lot of noise" that nobody uses, hindering incident identification and root cause analysis.
- Semantic Convention Instability: The promise of "one convention to rule them all" for standardized telemetry data (e.g., HTTP metrics looking exactly the same across services) has been hampered by slow stabilization and frequent changes. James Moyesus from Atlassian expressed frustration that conventions "keep changing it and it keeps breaking all of our metrics." He cited issues like Prometheus converting dots to underscores and back, causing inconsistencies. The prolonged effort to stabilize conventions, such as the HTTP semantic convention, has been a major pain point for early adopters.
- Collector Stability and Breaking Changes: Despite its power, the OpenTelemetry Collector isn't immune to issues. Adriel Perkins pointed out that the collector, particularly in its beta versions, can introduce internal interface breakage. This means that downstream distributions or custom collector builds that don't update frequently can suddenly face significant code changes to incorporate the latest fixes or features due to "things are so in lock step on the upstream." This instability makes maintaining custom collector setups challenging.
Where OpenTelemetry "Rocks":
- A Complete and Consistent Framework: OpenTelemetry is celebrated for being a comprehensive solution. Daniel Dyla emphasized that "it has to be a lot of things because it's a big problem that it's trying to solve." It provides a full framework from application instrumentation to delivering data to a backend, ensuring a consistent message across different components and languages.
- Ease of Adoption through Auto-Instrumentation: Despite its potential pitfalls, auto-instrumentation remains the "easiest way to get started with OpenTelemetry." Elena Grahovac affirmed that without it, "most people would not get started." It allows engineers, particularly in decentralized teams, to quickly gain observability without manual code changes, providing immediate value by observing their systems.
- The Power of Semantic Conventions (Once Stable): While stabilization has been slow, the semantic conventions, when stable, provide immense value. James Moyesus reiterated the "utopian kind of dream" of standardized HTTP metrics across microservices. The reason for the slow pace is a commitment to "guarantee of stability"—once a convention is stable (like the HTTP convention is now becoming), "they take it very very seriously" and "they're not going to break it." This long-term stability is crucial for large organizations with thousands of metrics.
- The Powerful OpenTelemetry Collector: Juraci Kröhling, though admitting bias, asserted the collector's "really, really powerful" capabilities, enabling users to "achieve so much." Its flexibility in processing, transforming, and exporting telemetry is a core strength.
- The Unparalleled Community: Perhaps the most significant "rocks" aspect highlighted was the OpenTelemetry community. The speakers emphasized that "we really could not do this without the community." Adriel Perkins lauded the community as his "first community of being really actively a part of in terms of open source contributions," praising the "bright people" who are "very kind and very good to work with across all of the different SIGs." He noted how interacting with such intelligent and helpful individuals (like the "super smart" person in the collector SIG with a "mental map of every line of code") has personally made him "a better engineer." The community's passion, helpfulness, and cordiality are seen as the project's ultimate strength.
Technical Deep Dive
▶ Watch: Auto-instrumentation causing high cardinality and collector overload (5:50)
The technical core of OpenTelemetry lies in its layered architecture, designed to provide flexible and standardized observability.
At the foundation is the OpenTelemetry Specification, which meticulously defines how telemetry data should be structured, including data models for traces, metrics, and logs, as well as the wire protocols for transmitting this data (e.g., OTLP - OpenTelemetry Protocol). This specification is the bedrock ensuring interoperability across different language implementations and vendor backends.
Building on the specification are the APIs and SDKs. The APIs provide a consistent interface for developers to interact with the OpenTelemetry system, regardless of the underlying language. For instance, an API call to start a span will look conceptually similar in Python, Java, or Node.js. The SDKs are the concrete implementations of these APIs for specific programming languages (e.g., otel-js for JavaScript, opentelemetry-java for Java). These SDKs handle the actual creation of telemetry data, manage context propagation, and provide mechanisms for exporting data. With approximately 13 languages supported, the challenge of maintaining consistency and feature parity across all SDKs is considerable.
Instrumentation Libraries are a crucial part of the ecosystem, enabling applications to generate telemetry. These come in two main forms:
- Manual Instrumentation: Developers explicitly add OpenTelemetry API calls to their code to create spans, metrics, or log entries. This offers granular control but requires significant code changes.
- Auto-Instrumentation: This is often the preferred starting point for many users due to its perceived ease. It typically involves injecting an agent (e.g., a Java agent, .NET profiler, or Python
sitecustomizescript) into the application runtime. This agent then uses bytecode manipulation, monkey patching, or other runtime hooks to automatically instrument common libraries and frameworks (e.g., HTTP clients/servers, database connectors, message queues) without requiring code modifications. - The "sucks" aspect arises here when auto-instrumentation is overly aggressive. As Elena Grahovac noted, it can lead to "extremely high cardinality" by capturing too many unique attribute values (e.g., instrumenting every unique SQL query string instead of just the query type) or "huge volume" by generating spans/metrics for every trivial internal call. This can overwhelm both the OpenTelemetry Collector and downstream observability backends, leading to increased costs and reduced signal-to-noise ratio. Tuning auto-instrumentation often requires delving into agent configuration to filter or sample telemetry.
Semantic Conventions are a set of predefined attribute names and values for common operations and components (e.g., HTTP, database calls, FaaS functions). Their purpose is to standardize how telemetry data describes operations, ensuring that a http.status_code attribute means the same thing regardless of the language or service generating it. This standardization is vital for building consistent dashboards, alerts, and analysis across a microservices architecture.
- The challenge, as James Moyesus highlighted, has been the slow pace of stabilization and the churn in early versions. For example, the precise attribute for an HTTP status code or how to represent network attributes has evolved. Furthermore, interactions with other systems, like Prometheus, can introduce friction; Prometheus's metric naming conventions (e.g., converting dots to underscores) can clash with OpenTelemetry's conventions, requiring careful transformation within the collector. The ongoing effort to stabilize these conventions, though slow, is critical, with the HTTP semantic convention being a notable recent success. The deliberate slowness reflects the community's commitment to ensuring stability once a convention is declared stable, avoiding future breaking changes.
The OpenTelemetry Collector is a powerful, vendor-agnostic proxy that receives, processes, and exports telemetry data. It's often deployed as a daemon, agent, or gateway. Its architecture is modular, composed of:
- Receivers: Components that ingest telemetry data from various sources (e.g., OTLP, Jaeger, Prometheus, Zipkin, Kafka).
- Processors: Components that transform, filter, enrich, or aggregate telemetry data (e.g., batching, attribute modification, sampling, PII redaction). This is where the OpenTelemetry Transformation Language (OTTL) comes into play, allowing complex data manipulation based on conditional logic. OTTL is "super powerful," enabling users to fine-tune the telemetry stream before it reaches an expensive backend.
- Exporters: Components that send processed telemetry data to various backends (e.g., OTLP, Prometheus, various vendor-specific APIs).
- The "sucks" aspect of the collector, as Adriel Perkins noted, relates to its rapid development cycle, particularly for features in beta versions. Internal interfaces within the collector can change, requiring significant code adjustments for those building custom distributions or relying on specific, unreleased features. This "lock-step" development means staying up-to-date can be a continuous effort.
In summary, OpenTelemetry provides a robust, comprehensive framework. However, its technical depth, the trade-offs in auto-instrumentation, the journey to stable semantic conventions, and the dynamic development of the collector require a thoughtful and informed approach from practitioners.
Demo / Proof of Concept
▶ Watch: Semantic conventions: promise vs. reality, breaking changes (7:50)
While the "OTel Sucks (But Also Rocks!)" talk did not feature a traditional live coding demonstration or a step-by-step technical proof of concept, its presentation style itself served as an innovative and highly effective "demonstration" of OpenTelemetry's real-world impact. The speakers, Juraci Paixão Kröhling and Daniel Dyla, chose to illustrate their points not through fabricated examples, but through genuine, recorded testimonials from fellow OpenTelemetry users and contributors.
These testimonials acted as a distributed "proof of concept" of the diverse experiences within the OpenTelemetry ecosystem.
- Adriel Perkins (Principal Engineer, The Atro, CI/CD SIG Lead) provided insights into the sheer breadth of OpenTelemetry and the challenges with collector stability.
- James Moyesus (Software Engineer, Atlassian) candidly discussed the frustrations and ultimate value of semantic conventions.
- Elena Grahovac (Principal Engineer, Delivery Hero) shared concrete examples of auto-instrumentation's benefits and its high-cardinality pitfalls in production.
- Alexander Magno (whose specific role wasn't detailed in the transcript but was presented as a collector user) implicitly demonstrated the collector's power through his positive feedback.
By weaving these personal narratives throughout the presentation, the speakers effectively demonstrated the duality of OpenTelemetry: the tangible problems encountered in real-world deployments contrasted with the profound benefits and the passionate community supporting its evolution. This approach underscored that the "sucks" and "rocks" aspects are not theoretical but deeply felt experiences by engineers working with the technology daily.
Furthermore, the speakers mentioned providing "a few extra slides" and "a couple of other videos from people with a spicier takes" via a QR code. This extended content acts as an off-stage, supplementary "demo" or "proof of concept" for those interested in diving deeper into the community's broader experiences and opinions, reinforcing the talk's core message of OpenTelemetry's complex reality.
Defensive Implications
▶ Watch: OpenTelemetry Collector: instability in beta versions (9:50)
Understanding the "sucks" and "rocks" aspects of OpenTelemetry provides critical insights for organizations adopting or currently using the framework. Defenders, whether SREs, platform engineers, or security professionals, can leverage this knowledge to build more resilient, cost-effective, and observable systems.
- Approach Auto-Instrumentation with Caution and Strategy:
- Tune Aggressively: While auto-instrumentation is excellent for rapid adoption, it's crucial to proactively tune it. Expect and plan for "high cardinality" and "huge volume" issues, as experienced by Delivery Hero with .NET and Java. Implement sampling, filtering, and attribute dropping mechanisms, ideally at the OpenTelemetry Collector level, to reduce noise and unnecessary data before it hits your observability backend.
- Prioritize Business-Critical Paths: Focus auto-instrumentation initially on known critical services and transactions. For less critical paths, consider selective manual instrumentation or more aggressive sampling.
- Monitor Telemetry Costs: High cardinality and volume directly translate to higher ingestion and storage costs. Continuously monitor the telemetry generated by auto-instrumentation and adjust configurations to optimize for cost and signal-to-noise ratio.
- Embrace and Contribute to Semantic Conventions:
- Leverage Stable Conventions: Actively adopt and enforce the use of stable semantic conventions (e.g., for HTTP, database calls) across all services. This standardization is key to building consistent dashboards, alerts, and correlation across your microservices, fulfilling the "utopian kind of dream" of standardized telemetry.
- Be Aware of Evolution for Unstable Conventions: For conventions still in beta or undergoing changes, exercise caution. Understand that early adoption might require adjustments. Consider contributing to the relevant OpenTelemetry SIGs to influence stabilization efforts, especially for domains critical to your organization.
- Implement Validation: Use the OpenTelemetry Collector's processing capabilities, perhaps with OTTL, to validate incoming telemetry against expected semantic conventions and transform data where necessary to ensure consistency before exporting.
- Strategically Manage the OpenTelemetry Collector:
- Understand Release Cycles: Be aware that the collector's rapid development, especially with beta components, can introduce "breaking changes" in internal interfaces. For production deployments, prioritize stable releases or carefully manage dependencies if using custom collector builds or downstream distributions.
- Leverage Processing Power: The collector is "really, really powerful." Utilize its processors to their full extent for tasks like:
- Sampling: Reducing the volume of traces.
- Filtering: Dropping irrelevant spans, metrics, or logs.
- Attribute Processing: Adding, renaming, or removing attributes to enrich data or reduce cardinality.
- Batching: Optimizing export efficiency.
- PII Redaction: Masking sensitive information before it leaves your control plane.
- Isolate and Test: Deploy collectors in a staged manner and thoroughly test configuration changes, especially those involving OTTL, to prevent production outages or data loss.
- Engage with the OpenTelemetry Community:
- Seek Guidance: The community is a treasure trove of knowledge and support. Engage in SIG meetings, GitHub discussions, and community forums when facing challenges. As Adriel Perkins noted, community members are "always ready to help" and "super smart."
- Contribute Back: Even small contributions—reporting issues, improving documentation, or sharing configurations—strengthen the project for everyone. Your experiences, both good and bad, are valuable to the project's evolution.
- Stay Informed: Keep abreast of new releases, API changes, and convention updates by following the official OpenTelemetry channels.
By internalizing these defensive implications, organizations can navigate the complexities of OpenTelemetry more effectively, harnessing its immense power for comprehensive observability while mitigating its operational challenges.
Key Takeaways
- OpenTelemetry is a comprehensive but complex framework: It offers a complete, vendor-agnostic solution for observability (traces, metrics, logs) but its vast scope (specifications, APIs, SDKs, instrumentation, collector, semantic conventions, OTTL) presents a steep learning curve.
- Auto-instrumentation is a double-edged sword: It provides the easiest entry point for rapid observability, but without careful tuning, it can generate "extremely high cardinality" and "huge volume" of unnecessary telemetry, leading to overloaded systems and increased costs.
- Semantic Conventions are crucial for standardization but require patience: While they promise a "utopian kind of dream" of consistent telemetry across services, their stabilization process has been slow and prone to breaking changes, though the commitment to long-term stability once finalized is a core strength.
- The OpenTelemetry Collector is powerful but needs careful management: It offers immense flexibility for processing, transforming, and exporting telemetry, but its rapid development cycle, especially in beta stages, can lead to internal interface changes that require vigilance from users building custom distributions.
- The OpenTelemetry community is its greatest asset: Despite the technical challenges, the project thrives on a vibrant, intelligent, kind, and supportive community of contributors who are passionate about observability and willing to help others become "better engineer[s]."
- OpenTelemetry is indispensable, despite its "sucks" moments: Its ability to provide a standardized, vendor-agnostic observability framework makes it a critical component for modern cloud-native architectures, even with its acknowledged "rough edges."
About the Speaker(s)
Juraci Paixão Kröhling is a Software Engineer at OligGarden. He presented alongside Daniel Dyla, sharing insights into the challenges and triumphs of OpenTelemetry from a practitioner's perspective.
Daniel Dyla is a Software Engineer at Dynatrace. He brings extensive experience to the OpenTelemetry project, having worked on it for approximately five years. His involvement includes serving on the governance committee and acting as a maintainer for oteljs, the OpenTelemetry JavaScript SDK.
The talk also featured valuable contributions and testimonials from several other prominent members of the OpenTelemetry community:
- Adriel Perkins is a Principal Engineer at a consulting company called The Atro in the United States. He is also the current project lead for the CI/CD special interest group (SIG) within OpenTelemetry and a co-owner of the GitHub and GitLab receiver components in the OpenTelemetry Collector.
- James Moyesus is a Software Engineer at Atlassian, working in their observability team for about four years, with daily involvement in various parts of OpenTelemetry.
- Elena Grahovac is a Principal Engineer at Delivery Hero, working within their developer platform organizational unit which provides platform capabilities including observability and resilience engineering.
- Alexander Magno provided a testimonial regarding the OpenTelemetry Collector.
Reviews
Dr. Zero (Offensive Security Researcher) — STRONG ACCEPT
This talk, provocatively titled 'OTel Sucks (But Also Rocks!)', delivers a brutally honest and deeply technical assessment of OpenTelemetry from the perspective of maintainers and heavy users. It cuts through the marketing hype to provide a balanced view of OTel's immense power and its significant operational challenges, using real-world examples and candid testimonials. The session offers invaluable, actionable insights for any practitioner navigating the complexities of modern observability, particularly regarding auto-instrumentation pitfalls, semantic convention stability, and the OpenTelemetry Collector's quirks.
Heather Calloway (CISO) — STRONG ACCEPT
This KubeCon talk offers a candid and critical assessment of OpenTelemetry, effectively balancing its undeniable power with its significant operational challenges. It highlights crucial areas like auto-instrumentation pitfalls and semantic convention instability, which directly impact an organization's ability to maintain reliable observability, manage costs, and respond effectively to incidents. The session provides actionable insights for platform and security leaders, emphasizing the need for strategic tuning, thoughtful management of the collector, and engagement with the community to harness OTEL's full potential for institutional resilience.