Pulling Data From Drawings Using AI
Ian Fox
S4x24 - ICS Security Conference · Day 1 · Stage 3
Overview
In the realm of Operational Technology (OT) and Industrial Control Systems (ICS), understanding the intricate interdependencies between digital assets and physical processes is paramount for effective security and operational resilience. Ian Fox's talk at S4 addresses a critical challenge: the difficulty of reasoning about large, complex industrial systems—such as factories and oil rigs—when much of their design and operational context is locked away in static, often outdated, engineering diagrams. This talk introduces a novel approach to overcome this hurdle by leveraging Artificial Intelligence (AI) to extract crucial data from these drawings and construct a dynamic, actionable graph model of the OT environment.
Key moments
- 0:00 Introduction and why data from drawings matters
- 0:40 Illustrative example: CVE alert context for pumps
- 1:30 Building the graph: IT tools, diagrams, desired model
- 2:40 Detailed explanation of diagram types used
- 4:00 AI plan: identify drawing elements, map to data
Pulling Data From Drawings Using AI
Speakers: Ian Fox
Conference: S4
YouTube: https://www.youtube.com/watch?v=bSIlrgfFHeU
Overview
In the realm of Operational Technology (OT) and Industrial Control Systems (ICS), understanding the intricate interdependencies between digital assets and physical processes is paramount for effective security and operational resilience. Ian Fox's talk at S4 addresses a critical challenge: the difficulty of reasoning about large, complex industrial systems—such as factories and oil rigs—when much of their design and operational context is locked away in static, often outdated, engineering diagrams. This talk introduces a novel approach to overcome this hurdle by leveraging Artificial Intelligence (AI) to extract crucial data from these drawings and construct a dynamic, actionable graph model of the OT environment.
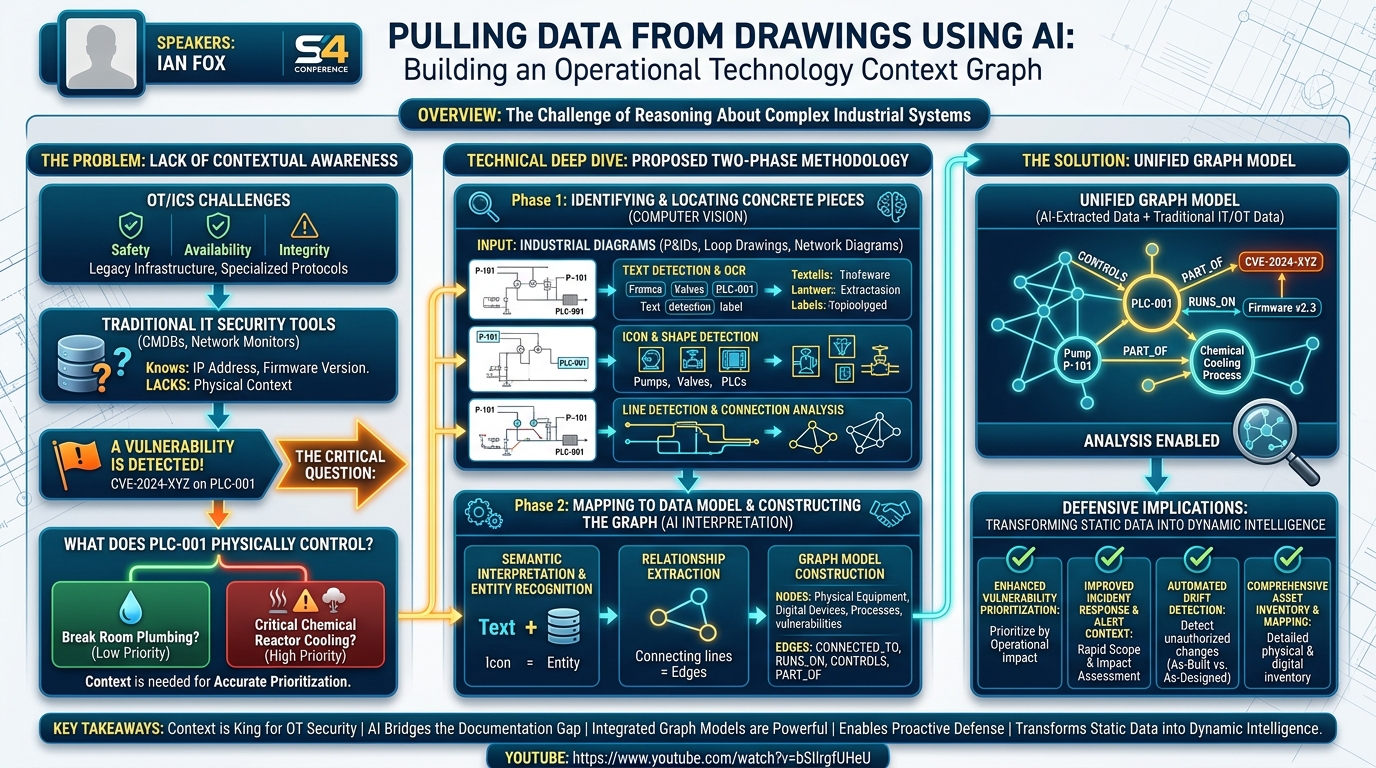
The core problem this presentation tackles is the lack of contextual awareness in OT security operations. When a vulnerability like CVE 2024 XYZ is detected on a Programmable Logic Controller (PLC), security teams often struggle to ascertain its real-world impact. Is the affected PLC controlling a critical cooling process for a chemical reactor, or merely the plumbing in a break room? The ability to rapidly answer such questions is vital for accurate vulnerability prioritization, putting security alerts in proper context, and detecting "drift" between a system's design and its operational reality. Fox's work proposes that by combining traditional IT/OT security data with AI-extracted insights from engineering diagrams, organizations can build a comprehensive security posture that reflects the true operational criticality of their assets.
The solution presented centers on creating a unified graph model that integrates information from diverse sources, including network monitoring tools, Configuration Management Databases (CMDBs), and, most importantly, industrial diagrams and documents. This integrated model provides a holistic view, linking digital vulnerabilities to specific software/firmware versions, network connections, and ultimately, the physical equipment and overarching industrial processes they control. By automating the extraction of this critical process context from often complex and visually dense drawings, the approach aims to significantly enhance decision-making for OT security and operational teams, transforming static documentation into dynamic intelligence.
Background
▶ Watch: Introduction and why data from drawings matters (0:00)
The challenges in securing Operational Technology (OT) environments are multifaceted, stemming from their unique operational priorities, legacy infrastructure, and specialized communication protocols. Unlike traditional IT systems, OT environments prioritize safety, availability, and integrity, often making patching cycles complex and infrequent. A fundamental obstacle to effective OT security is the sheer complexity and scale of modern industrial systems. These environments are characterized by a vast array of interconnected devices, sensors, actuators, and controllers, all working in concert to manage physical processes. Understanding the relationships between these components, and how a compromise in one area might cascade through the system, is a significant analytical burden.
Traditional IT security tools like network monitoring solutions and CMDBs provide valuable data on digital assets, their software versions, and network connectivity. However, they inherently lack the crucial context of the physical world. A CMDB might tell you that a specific PLC is running a vulnerable firmware version, and a network monitor might show its IP address and network segment. What these tools typically cannot tell you is what that PLC physically controls, its role within a broader industrial process, or the potential safety, environmental, or production impacts should it be compromised. This gap in contextual understanding leads to reactive security postures, inefficient resource allocation for patching, and delayed incident response when the criticality of an alert cannot be immediately determined.
Historically, this critical process context has been maintained in various forms of engineering documentation: physical drawings, digital blueprints, and operational manuals. These documents, while rich in detail, are static, often outdated, and not easily parsable by automated systems. To gain this context, security analysts or incident responders often have to manually consult these diagrams, interview operators, or rely on tribal knowledge—processes that are time-consuming, prone to human error, and not scalable across large, dynamic facilities.
Ian Fox specifically highlights three types of industrial diagrams as crucial sources of this missing context:
- Network Diagrams: These illustrate the logical and physical layout of industrial networks, showing devices, their interconnections, and network segmentation. They provide insights into the digital architecture and communication pathways.
- Loop Drawings: These diagrams detail the control loops, showing how digital devices (controllers, sensors) are connected to and control specific pieces of physical hardware (valves, pumps, motors). They bridge the gap between the digital control system and the physical equipment.
- Piping and Instrumentation Diagrams (P&IDs): These are perhaps the most comprehensive, mapping functional assets to the overall process level. P&IDs depict the process flow, showing pipes, vessels, pumps, valves, and instrumentation, along with their relationships and control mechanisms. They are essential for understanding the operational criticality of individual components within the larger industrial process.
Examples from the SWAT project (Singapore University of Technology and Design) and the Open Industrial Data Project demonstrate the visual complexity of these diagrams, characterized by numerous icons representing physical components and lines denoting connections like pipes or electrical signals. The challenge, therefore, is to transform this wealth of visual and textual information, currently accessible primarily to human experts, into a machine-readable format that can enrich security analysis and decision-making.
Key Findings
▶ Watch: Illustrative example: CVE alert context for pumps (0:40)
The central "finding" or contribution of this work is the proposed methodology itself: the demonstration of a viable and impactful strategy for automatically extracting and structuring critical operational context from industrial engineering drawings using AI. This approach directly addresses the longstanding challenge of integrating physical process understanding with digital security intelligence in OT environments.
The key findings can be summarized as:
- Feasibility of AI-driven Context Extraction: The talk establishes that it is technically feasible to employ AI, specifically computer vision and potentially natural language processing techniques, to parse complex industrial diagrams. This includes identifying and locating fundamental visual elements such as text labels, specific icons representing equipment, lines indicating connections, and geometric shapes denoting boundaries or functional areas.
- Bridging the IT/OT Context Gap: By successfully extracting this information, the method provides a crucial bridge between the "cyber tools" data (vulnerability reports, network monitor data from CMDBs) and the "process context" (physical equipment, operational function, criticality). This allows for a holistic understanding of a system, enabling security teams to move beyond merely identifying a vulnerable digital asset to understanding its real-world impact within the industrial process.
- Foundation for a Comprehensive Graph Model: The extracted data forms the basis for constructing a robust graph model. This model represents industrial environments as a network of interconnected nodes (devices, software, processes, physical equipment) and edges (relationships like "runs on," "connected to," "controls," "part of"). This graph structure is inherently powerful for representing complex interdependencies and facilitating advanced analytical queries.
- Enabling Contextual Security Decisions: The ultimate finding is that this AI-driven approach significantly enhances critical security functions. It enables more accurate vulnerability prioritization by linking vulnerabilities to their process impact, provides richer context for security alerts, and facilitates the detection of drift between designed and operational states. For instance, knowing that a vulnerable PLC controls a chemical process's cooling system rather than a breakroom pump fundamentally alters the urgency and resource allocation for remediation.
Essentially, the talk presents a blueprint for transforming static, human-interpretable engineering documents into dynamic, machine-queryable intelligence, thereby unlocking a new level of contextual awareness for OT security and operations.
Technical Deep Dive
▶ Watch: Building the graph: IT tools, diagrams, desired model (1:30)
The technical approach outlined by Ian Fox involves a two-phase process for transforming raw industrial diagrams into a structured, machine-readable graph model. This process leverages various AI and data engineering techniques to interpret the visual and textual information embedded within these complex documents.
Phase 1: Identifying and Locating Concrete Low-Level Pieces
The initial phase focuses on the raw visual and textual content of the diagrams. This is primarily a computer vision challenge, requiring algorithms to accurately detect and classify various elements present on a drawing.
- Text Detection and Optical Character Recognition (OCR):
- Goal: Identify all textual annotations (labels, identifiers, values) within the diagram and convert them into machine-readable text.
- Techniques: Advanced OCR engines are required, often fine-tuned for the specific fonts, sizes, and orientations common in engineering drawings. Challenges include varying text quality, overlapping elements, and text placed along curves or within dense areas. The system must not only extract the text but also its precise location on the drawing.
- Example: Extracting "P-101" (pump identifier), "Flow Transmitter FT-205," or "Ethernet/IP" from a network connection label.
- Icon and Shape Detection:
- Goal: Identify and classify the various standardized and proprietary icons and shapes that represent physical equipment (pumps, valves, tanks), digital devices (PLCs, HMIs, switches), and logical constructs (control loops, functional blocks).
- Techniques: Object detection models (e.g., YOLO, Faster R-CNN, Mask R-CNN) trained on large datasets of industrial symbols would be employed. These models learn to recognize patterns, edges, and textures associated with specific icons. Semantic segmentation might also be used to precisely delineate the boundaries of complex shapes.
- Challenges: The vast diversity of industry standards (ISA, ISO, ANSI) and proprietary symbols from different vendors requires a flexible and extensible detection framework. Variations in drawing styles, scale, and even scan quality can impact accuracy.
- Example: Recognizing a specific pump icon, a control valve symbol, or a PLC module.
- Line Detection and Connection Analysis:
- Goal: Identify all lines within the diagram and understand their topological relationships. Lines typically represent physical connections (pipes, conduits) or logical connections (data links, control signals).
- Techniques: Image processing algorithms for line detection (e.g., Hough Transform, Canny edge detection) are fundamental. More advanced methods involve graph-based image segmentation to group connected line segments and analyze their endpoints.
- Challenges: Distinguishing between different types of lines (solid vs. dashed, thick vs. thin, various colors indicating different media), handling intersections, and accurately identifying start and end points of connections.
- Example: Detecting a solid line connecting a pump icon to a tank icon, inferring a pipe connection. Detecting a dashed line connecting a PLC to a sensor, inferring a control signal.
Phase 2: Mapping to a Data Model and Constructing the Graph
Once the low-level elements are identified and located, the second phase focuses on interpreting their meaning and structuring them into a coherent graph data model. This involves semantic understanding and relationship extraction.
- Semantic Interpretation and Entity Recognition:
- Goal: Assign meaning to the detected elements. A text label like "P-101" combined with a pump icon identifies a specific pump entity. A dotted rectangle around several devices might signify a subnet or a functional area.
- Techniques: This often involves a combination of rules-based systems, Natural Language Processing (NLP) for interpreting text labels and their proximity to icons, and potentially machine learning classifiers trained to associate visual patterns with specific industrial concepts.
- Example: A detected "pump" icon with the adjacent text "P-101" is identified as the entity "Pump P-101." A dotted rectangle containing several network devices and the text "Control Network A" defines a network segment.
- Relationship Extraction:
- Goal: Identify how the various entities are connected and related. Lines become edges in the graph, representing specific types of relationships.
- Techniques: Analyzing the endpoints of detected lines, the spatial proximity of elements, and the semantic meaning of connecting labels. For instance, a line connecting a "PLC-001" entity to a "Valve V-203" entity, especially if accompanied by control signal labels, creates an "controls" relationship.
- Example: A line between "Pump P-101" and "Tank T-002" might become a "pumps_into" relationship. A line between "PLC-001" and "Network Switch SW-005" becomes a "connected_to" relationship.
- Graph Model Construction:
- Architecture: The extracted entities become nodes in a graph database (e.g., Neo4j, Amazon Neptune). Relationships become edges connecting these nodes, with properties describing the nature of the connection.
- Nodes: Represent various entities:
- Physical Equipment: Pumps, valves, tanks, motors (e.g.,
(Pump {id: "P-101", type: "Centrifugal"})) - Digital Devices: PLCs, HMIs, network switches, sensors, actuators (e.g.,
(PLC {id: "PLC-001", model: "Siemens S7-1500"})) - Software/Firmware: Operating systems, application software, firmware versions (e.g.,
(Firmware {version: "v2.3", vendor: "Siemens"})) - Network Segments: Subnets, VLANs (e.g.,
(NetworkSegment {name: "Control Network A", subnet: "192.168.10.0/24"})) - Processes/Functions: Cooling process, mixing process (e.g.,
(Process {name: "Chemical Cooling"})) - Vulnerabilities: CVEs (e.g.,
(CVE {id: "CVE-2024-XYZ", severity: "High"})) - Edges: Represent relationships:
CONNECTED_TO: Between network devices, or digital devices and physical equipment.RUNS_ON: Software/firmware on a digital device.CONTROLS: Digital device controlling physical equipment.PART_OF: Equipment part of a larger process.AFFECTS: CVE affecting software/firmware.- Data Integration: This graph model is then integrated with data from traditional IT/OT security tools. A CMDB can populate nodes with software versions and configurations. Network monitoring data can validate network connections and provide real-time status. Vulnerability databases link CVEs to specific software/firmware versions. The AI-extracted data from diagrams provides the crucial physical and process context that these other sources lack.
By combining these technical steps, the system moves from raw pixel data to a rich, interconnected knowledge graph that provides an unprecedented level of contextual understanding for OT security analysis. This structured data can then be queried to answer complex questions about vulnerability impact and operational criticality.
Demo / Proof of Concept
▶ Watch: Detailed explanation of diagram types used (2:40)
While the talk did not feature a live demonstration of a fully operational system, Ian Fox effectively presented the conceptual Proof of Concept (PoC) by outlining the "basic plan" and showing illustrative examples of the types of diagrams the system would process. The core idea of this PoC is to demonstrate the feasibility and value of automatically constructing a comprehensive graph model from industrial drawings.
The conceptual demonstration would proceed as follows:
- Input: The system would ingest various types of industrial diagrams, such as the P&ID from the SWAT project or the Open Industrial Data Project that Fox showed. These diagrams, rich with icons, text, and connecting lines, serve as the raw data source.
- AI Processing: The system would then apply the two-phase AI process detailed in the technical deep dive:
- Identification and Location: AI algorithms would scan the input diagrams to detect and locate all relevant elements: text labels (e.g., "P-101," "FT-205"), specific equipment icons (pumps, valves, sensors), and various types of lines (pipes, control signals, network connections).
- Semantic Mapping: The identified elements would then be interpreted. For instance, a pump icon adjacent to "P-101" would be recognized as "Pump P-101." A line connecting two devices would be interpreted as a specific type of connection (e.g., a process pipe, an electrical signal, a network cable). Dotted rectangles might delineate subnets or functional areas.
- Graph Generation: The interpreted elements and their relationships would be used to populate a graph database. Each identified component (e.g., a specific pump, a PLC, a network switch, a chemical process) would become a node, and each detected connection or relationship (e.g., "controls," "connected to," "is part of") would become an edge between nodes.
- Data Enrichment: This AI-generated graph would then be integrated with existing data sources. For example, a CMDB might provide specific model numbers, firmware versions, or IP addresses for the digital devices identified in the drawings. Network monitoring data could confirm active connections. Vulnerability databases would link specific CVEs to the identified software or firmware versions.
- Querying for Context: The power of the PoC lies in demonstrating how this integrated graph can answer critical security questions. For example, a query could identify all physical equipment controlled by a PLC affected by CVE 2024 XYZ, and then determine which industrial processes those pieces of equipment are part of. This would immediately highlight whether the vulnerability affects a critical cooling process or a less critical auxiliary system, as per the speaker's initial example.
The use of real-world (albeit illustrative) diagrams from projects like SWAT and Open Industrial Data serves to ground the conceptual PoC in practical reality, showcasing that the complexity of actual industrial documentation can indeed be processed by the proposed AI framework. The "plan" itself, with its detailed steps for element identification and semantic mapping, functions as the blueprint for the system's operation, proving its conceptual viability.
Defensive Implications
▶ Watch: AI plan: identify drawing elements, map to data (4:00)
The ability to automatically pull context from industrial drawings using AI presents a transformative shift for OT security posture and incident response. The defensive implications are profound, enabling organizations to move from reactive, generalist security measures to highly contextualized, proactive, and efficient strategies.
- Enhanced Vulnerability Prioritization:
- Current Challenge: OT security teams often struggle to prioritize patching efforts due to a lack of understanding of a vulnerability's real-world impact. All critical vulnerabilities might appear equally urgent.
- AI Solution: By linking CVEs to specific software/firmware, then to digital devices, and finally to the physical equipment and industrial processes they control (as derived from P&IDs and loop drawings), defenders can determine the true operational criticality. A vulnerability affecting a PLC controlling a critical safety interlock for a high-pressure vessel will receive immediate attention, while the same vulnerability on a PLC managing a non-essential utility system can be deprioritized. This allows for intelligent resource allocation and minimized operational disruption from unnecessary urgent patching.
- Improved Incident Response and Alert Context:
- Current Challenge: OT Security Operations Center (SOC) analysts often receive alerts lacking sufficient context. Identifying the affected component is one thing; understanding its function and dependencies within the larger process is another.
- AI Solution: When an alert is triggered (e.g., suspicious activity on PLC-001), the graph model can instantly provide a comprehensive view: what networks is it on, what software is it running, what physical valves/pumps does it control, and which critical process is it part of? This immediate context drastically reduces the time to understand the incident's scope, potential impact, and appropriate response actions, allowing analysts to gauge "how much time they have to deal with it."
- Automated Drift Detection:
- Current Challenge: Industrial systems evolve over time. Changes are made, equipment is upgraded or reconfigured, and often these "as-built" or "as-operated" states diverge from the original "as-designed" drawings. Detecting this drift manually is arduous and often overlooked.
- AI Solution: The AI-generated graph model from the "as-designed" drawings can be continuously compared against live operational data from network monitoring tools, CMDBs, and even sensor data. Discrepancies—such as a new network connection not present in the drawing, a device running a different firmware version, or a control loop reconfigured—can be automatically flagged. This enables proactive identification of unauthorized changes, configuration errors, or potential security blind spots arising from outdated documentation.
- Comprehensive Asset Inventory and Mapping:
- Current Challenge: Maintaining an accurate and complete asset inventory in OT is notoriously difficult, especially for physical assets and their logical connections to digital systems.
- AI Solution: The system automatically builds a detailed inventory of both digital and physical assets, including their interconnections and roles in processes. This provides a foundational layer for all other security activities, ensuring that no critical asset is overlooked in risk assessments or security controls implementation.
- Enhanced Risk Assessment and Compliance:
- Current Challenge: Conducting thorough risk assessments in OT environments requires a deep understanding of process hazards and control mechanisms. Demonstrating compliance with standards like ISA/IEC 62443 often requires detailed documentation of system architecture and controls.
- AI Solution: The structured graph model provides an unprecedented level of detail for risk assessment, allowing for impact analysis based on process criticality. It also simplifies compliance efforts by providing an auditable, machine-readable representation of the industrial control system's design and operational context.
In essence, this AI-driven approach transforms static documentation into dynamic, actionable intelligence, empowering defenders with the contextual awareness needed to proactively secure complex OT environments and respond effectively to emerging threats.
Key Takeaways
- Context is King for OT Security: Understanding the physical process context of digital assets is crucial for effective vulnerability prioritization, incident response, and risk management in OT environments.
- AI Bridges the Documentation Gap: Artificial Intelligence, particularly computer vision and NLP, can automatically extract critical operational data from complex industrial engineering diagrams (P&IDs, loop drawings, network diagrams).
- Integrated Graph Models are Powerful: The extracted data, combined with insights from traditional IT/OT security tools (CMDBs, network monitors), forms a comprehensive graph model that links vulnerabilities to digital assets, physical equipment, and industrial processes.
- Enables Proactive Defense: This contextualized graph model allows defenders to prioritize vulnerabilities based on real-world process impact, accelerate incident response by providing immediate context, and detect "drift" between designed and operational systems.
- Transforms Static Data into Dynamic Intelligence: The approach converts static, human-readable engineering documents into dynamic, machine-queryable intelligence, significantly enhancing the analytical capabilities of OT security teams.
About the Speaker(s)
Ian Fox presented the talk "Pulling Data From Drawings Using AI" at the S4 conference. Based on the technical depth and specific focus of his presentation, Ian is a researcher or engineer with expertise in applying Artificial Intelligence, particularly computer vision and natural language processing, to complex problems within the domain of Operational Technology (OT) and Industrial Control System (ICS) security. His work demonstrates a keen understanding of the unique challenges faced by industrial organizations in managing security within highly integrated physical and digital environments.
Reviews
Dr. Zero (Offensive Security Researcher) — STRONG ACCEPT
This talk presents a genuinely novel and impactful approach to a critical problem in OT security: bridging the gap between digital asset intelligence and physical process context. By leveraging AI to parse complex industrial engineering diagrams and build a dynamic graph model, Ian Fox outlines a solution that directly addresses the lack of contextual awareness in vulnerability management and incident response. It's a clear demonstration of how advanced techniques can yield actionable intelligence, moving beyond buzzwords to deliver real value for defenders in a notoriously challenging environment.
Heather Calloway (CISO) — STRONG ACCEPT
Ian Fox’s presentation on leveraging AI to extract critical context from industrial drawings addresses a fundamental gap in OT security: the inability to precisely map digital vulnerabilities to their real-world physical and process impacts. This work is a strong step towards institutional realism, enabling clear risk ownership and vastly improving our capacity to prioritize vulnerabilities and respond to incidents with an accurate understanding of business exposure. It transforms static documentation into dynamic, actionable intelligence, which is precisely what security leaders need to make informed decisions in complex operational environments.