Hot New Gameshow: My Favorite Metric!
Ron Fabela
S4x24 - ICS Security Conference · Day 3 · Stage 2
Overview
At the S4 conference, Ron Fabela hosted a unique and engaging session titled "My Favorite Metric," structured as a gameshow. The premise was simple yet profound: contestants were given three minutes to pitch their most impactful Operational Technology (OT) security metric to a panel of expert judges, vying for cash prizes. This innovative format aimed to unearth and critically evaluate metrics that truly matter in the complex and often opaque world of industrial control systems (ICS) and critical infrastructure security.
Key moments
- 0:00 Welcome to My Favorite Metric game show
- 1:06 Az Kahun pitches Incident Root Cause Analysis
- 2:50 Benefits: RCA reduces repeated incidents, improves posture
- 4:00 Judges score Az's Root Cause Analysis metric
- 5:30 David Ong introduces his complex metric
- 10:00 Judges score David, expressing confusion
Hot New Gameshow: My Favorite Metric!
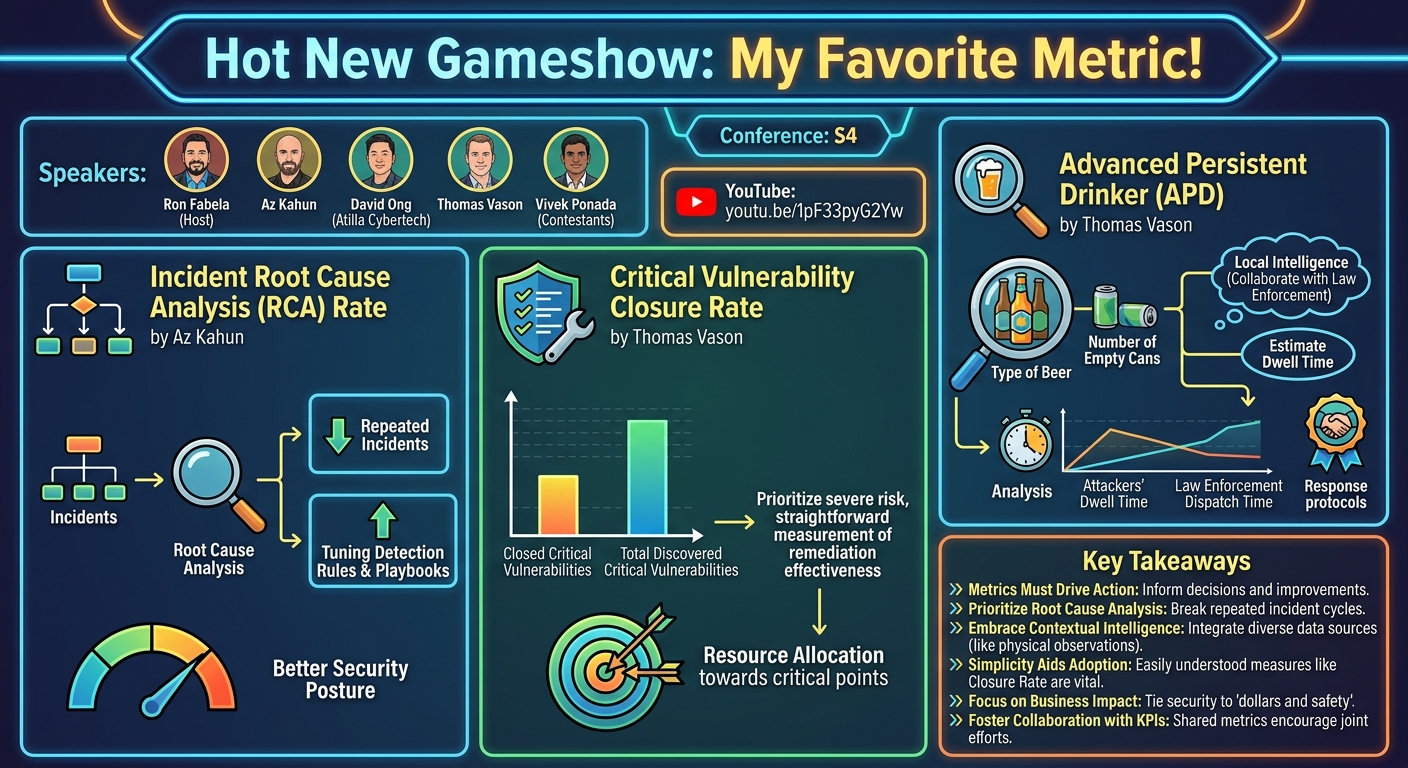
Speakers: Ron Fabela (Host), Az Kahun, David Ong (Atilla Cybertech), Thomas Vason, Vivek Ponada (Contestants)
Conference: S4
YouTube: https://www.youtube.com/watch?v=1pF33pyG2Yw
Overview
At the S4 conference, Ron Fabela hosted a unique and engaging session titled "My Favorite Metric," structured as a gameshow. The premise was simple yet profound: contestants were given three minutes to pitch their most impactful Operational Technology (OT) security metric to a panel of expert judges, vying for cash prizes. This innovative format aimed to unearth and critically evaluate metrics that truly matter in the complex and often opaque world of industrial control systems (ICS) and critical infrastructure security.
The session highlighted a significant challenge within OT security: the difficulty of effectively measuring progress, risk, and program effectiveness. Unlike traditional IT environments with established metrics for vulnerabilities, incidents, and compliance, OT often lacks standardized, actionable measurements that resonate with both technical teams and executive leadership. The "My Favorite Metric" gameshow provided a platform for security professionals to champion novel or underappreciated metrics designed to drive tangible improvements in OT security posture, foster better collaboration, and provide clear insights into operational risk.
The talk underscored the critical need for metrics that move beyond superficial reporting to genuinely inform decision-making and resource allocation in OT environments. By presenting diverse perspectives on what constitutes a "favorite" metric—ranging from deeply technical incident analysis to surprisingly contextual environmental observations—the session offered a rich discussion on how to quantify and communicate security efficacy in a domain where the stakes are exceptionally high, often involving physical safety and continuous operations.
Background
▶ Watch: Welcome to My Favorite Metric game show (0:00)
The landscape of Operational Technology (OT) security presents unique challenges that distinguish it from conventional Information Technology (IT) security. While IT security often focuses on data confidentiality and integrity, OT security prioritizes availability, safety, and reliability of physical processes. Traditional IT metrics, such as Mean Time To Detect (MTTD) or Mean Time To Respond (MTTR), while useful, often fall short in capturing the full spectrum of risk and improvement opportunities within OT environments. These metrics, focused on speed, can inadvertently de-incentivize thorough investigation and long-term problem solving, especially when the root causes of incidents are deeply embedded in operational processes or legacy systems.
The problem stems from several factors. OT systems are often characterized by proprietary protocols, legacy hardware, and extended operational lifecycles, making patching and traditional security controls difficult or impossible to implement without risking operational disruption. Furthermore, the convergence of IT and OT networks has introduced new attack vectors, increasing the complexity of securing these environments. Organizations struggle to answer fundamental questions: How secure are we? Are our investments yielding tangible improvements? How do we communicate OT risk to the board in a way that is understandable and actionable?
Existing frameworks like NIST CSF or IEC 62443 provide guidance but don't prescribe specific, universally applicable metrics that can directly track progress or measure the effectiveness of security controls in diverse industrial settings. This gap often leads to reliance on "vanity metrics" that look good on paper but fail to drive real change or provide deep insights into the underlying security posture. The "My Favorite Metric" gameshow sought to address this by challenging practitioners to propose metrics that are not only measurable but also actionable, contextual, and impactful for the unique demands of OT security. The goal was to shift the focus from merely reporting numbers to using metrics as a powerful tool for continuous improvement, strategic decision-making, and fostering a proactive security culture within critical infrastructure organizations.
Key Findings
▶ Watch: Benefits: RCA reduces repeated incidents, improves posture (2:50)
The "My Favorite Metric" gameshow showcased several distinct approaches to measuring and improving OT security, each with its own rationale and potential impact. While not all contestants' pitches were fully detailed in the provided transcript, the session highlighted a range of metrics from process-oriented to highly contextual, demonstrating the diverse needs and challenges in the OT space.
The first contestant, Az Kahun, proposed the Incident Root Cause Analysis (RCA) Rate. This metric focuses on the proportion of incidents for which a thorough root cause analysis has been completed. Kahun argued that while traditional metrics like MTTD and MTTR emphasize speed, they often neglect the deeper investigation needed to prevent recurrence. A high RCA rate, he contended, signifies stronger forensics, encourages tuning of detection rules and playbooks, and ultimately leads to a better overall security posture by addressing systemic issues rather than just symptoms. He presented a simple chart illustrating that as the RCA rate improves, repeated incidents decrease, and false positives diminish.
David Ong, from Atilla Cybertech in Singapore, presented a metric that, unfortunately, was not clearly articulated in the provided transcript. The scoring portion referred to an "APD threat or stat metric," but the preceding monologue largely repeated Az Kahun's pitch on RCA rate. This highlights a challenge in live conference reporting and the need for clear, concise metric definitions. Based on the judges' comments, his metric was perceived as "jumbled" and "too complicated," suggesting a lack of clarity in presentation, rather than a fundamental flaw in the metric itself.
Thomas Vason introduced a highly unconventional, yet surprisingly actionable, metric he termed the Advanced Persistent Drinker (APD) metric. This metric emerged from a specific, recurring physical security problem at wind sites: seasonal break-ins where attackers consistently left behind empty beer cans. Vason's metric involved documenting the type and number of beer cans found. While initially seeming humorous, he demonstrated its practical application: identifying local areas selling specific beer brands to collaborate with law enforcement, and estimating the dwell time of attackers based on the number of cans consumed. This dwell time could then be used to assess the effectiveness of law enforcement dispatch times, potentially leading to in-the-act apprehensions.
The transcript also briefly mentioned Vivek Ponada, who advocated for metrics that "matter to us," specifically relating to dollars and safety, moving beyond "pew pew maps." However, his full metric was not detailed before the transcript cut off. Similarly, Jack Schultz was announced as a runner-up, but his metric was not described in the provided material.
Finally, Thomas Vason returned to present a second, more traditional metric: the Critical Vulnerability Closure Rate. This metric is calculated by dividing the number of critical vulnerabilities fixed in a given period by the total number of critical vulnerabilities discovered in that same period. Vason emphasized its simplicity and straightforwardness as a measure of remediation effectiveness for the most severe risks.
The collective takeaway from these presentations was the diverse nature of effective metrics. They can be process-focused (RCA rate), highly contextual and incident-driven (APD), or directly tied to risk remediation (Critical Vulnerability Closure Rate), but they must always aim for clarity, actionability, and relevance to the specific OT environment.
Technical Deep Dive
▶ Watch: Judges score Az's Root Cause Analysis metric (4:00)
The metrics presented, though diverse in their scope and application, shared a common underlying goal: to provide actionable intelligence for improving OT security. Each metric, whether traditional or unconventional, offered a specific way to quantify an aspect of security posture or operational risk.
Incident Root Cause Analysis (RCA) Rate
Proposed by Az Kahun, the RCA Rate is a process-oriented metric designed to gauge the effectiveness of an organization's incident response and post-incident learning capabilities.
- Calculation:
(Number of Incidents with Completed RCA) / (Total Number of Incidents)within a defined period. - Technical Rationale: The core idea is that merely resolving an incident quickly (as measured by MTTR) does not prevent its recurrence if the underlying cause remains unaddressed. A robust RCA process involves deep investigation into the technical, procedural, or human factors contributing to an incident. This includes identifying specific vulnerabilities (e.g., unpatched software, misconfigured devices), policy gaps, or training deficiencies.
- Impact: A higher RCA rate directly correlates with a reduced likelihood of repeated incidents. By systematically identifying root causes, teams can:
- Tune Detection Rules: Refine Security Information and Event Management (SIEM) or Security Orchestration, Automation, and Response (SOAR) rules to detect specific attack patterns or indicators identified during RCA.
- Enhance Playbooks: Update incident response playbooks with new insights and remediation steps to handle similar future incidents more efficiently.
- Improve Forensics: Develop stronger forensic capabilities within the team, leading to more thorough investigations.
- Drive Process Improvements: Identify and rectify systemic issues in security controls, operational procedures, or even organizational culture.
- Foster Collaboration: Encourage collaboration between OT security, IT, and operational teams by sharing insights from RCA, leading to joint ownership of solutions.
- Kahun's academic chart, devised at 5 AM, humorously but effectively illustrated the concept: as RCA rate improves, repeated incidents decrease, and false positives decrease, leading to a "much better life" for analysts. This metric shifts the focus from reactive speed to proactive, systematic improvement.
Advanced Persistent Drinker (APD) Metric
Thomas Vason's APD metric is an example of a highly contextual and unconventional metric derived from physical security incidents in remote OT sites (wind farms).
- Calculation: This isn't a single numerical value but rather a collection of data points:
- Type of Beer: Brand and sometimes origin (e.g., American, Canadian).
- Number of Empty Cans: Count of discarded containers.
- Technical Rationale & Actionability: While seemingly anecdotal, this data becomes actionable when correlated with other intelligence:
- Attribution & Intelligence: Identifying specific beer brands allows for collaboration with local law enforcement to determine where these brands are sold in the vicinity of the wind sites. This could lead to identifying specific convenience stores or establishments, which might have surveillance footage or local intelligence on individuals purchasing these items.
- Dwell Time Estimation: The number of empty beer cans provides a proxy for the attackers' dwell time at the site. Assuming an average time to consume one beer (e.g., 15-30 minutes, "assuming they're not shotgunning it"), multiple cans suggest an extended presence. For example, 18 cans might indicate 2-3 individuals present for 1-2 hours.
- Response Time Evaluation: This estimated dwell time can then be compared against the dispatch time of local law enforcement from the moment a physical security alarm (e.g., door alarm) is triggered. If the dwell time consistently exceeds the response time, it highlights a critical gap, indicating that law enforcement is unlikely to catch perpetrators in the act. This intelligence can drive discussions with law enforcement to improve response protocols or inform the deployment of additional physical security measures (e.g., on-site cameras, faster response units).
- The APD metric demonstrates that effective security metrics don't always need to be complex digital readouts; sometimes, environmental forensics can provide crucial operational intelligence.
Critical Vulnerability Closure Rate
Also presented by Thomas Vason, this metric is a more traditional, risk-focused metric directly tied to vulnerability management.
- Calculation:
(Number of Critical Vulnerabilities Fixed in Period) / (Total Number of Critical Vulnerabilities Discovered in Period) - Technical Rationale: In OT, not all vulnerabilities are created equal. Critical vulnerabilities are those that pose the highest risk to safety, operations, or availability. Focusing on their closure rate ensures that remediation efforts are prioritized where they matter most. This metric provides a clear, quantifiable measure of an organization's effectiveness in addressing its most severe security flaws.
- Impact:
- Prioritization: Drives teams to focus resources on the most impactful vulnerabilities rather than being overwhelmed by a high volume of lower-severity findings.
- Accountability: Provides a direct measure of the vulnerability management program's success and the remediation teams' performance.
- Board-Level Reporting: Its simplicity makes it easy to communicate to executive leadership and board members, demonstrating tangible progress in reducing critical risk.
- Resource Allocation: Helps justify resources for patching, configuration management, or other remediation activities by showing a direct impact on critical risk reduction.
While David Ong and Vivek Ponada's metrics were not fully elaborated, the emphasis on "dollars and safety" by Ponada suggests a move towards business impact metrics—quantifying security in terms of financial loss avoidance or reduction in safety incidents. This aligns with a growing trend in security to speak the language of the business rather than purely technical jargon. The varied approaches underscore the need for a flexible and pragmatic view of metrics in OT.
Demo / Proof of Concept
▶ Watch: David Ong introduces his complex metric (5:30)
The "My Favorite Metric" session was structured as a gameshow rather than a traditional technical presentation with live demonstrations. As such, no software, hardware, or exploit proof-of-concept was demonstrated. Instead, the contestants "demonstrated" their metrics conceptually through their verbal pitches, explaining the calculation, rationale, and actionable insights derived from each proposed metric. The judges then scored the metrics based on their clarity, innovation, and perceived utility.
Defensive Implications
▶ Watch: Judges score David, expressing confusion (10:00)
The metrics highlighted in "My Favorite Metric" offer several crucial implications for OT defenders, encouraging a shift towards more strategic, actionable, and context-aware security practices.
Firstly, Az Kahun's Incident Root Cause Analysis (RCA) Rate underscores the critical need for OT incident response teams to move beyond merely containing and eradicating threats quickly. While speed is important, a sustained focus on a high RCA rate means that security incidents become learning opportunities. Defenders should:
- Prioritize Thorough Investigation: Allocate sufficient time and resources for post-incident analysis, even after immediate containment. This may require dedicated roles or specialized training in forensic analysis for OT systems.
- Integrate RCA into Playbooks: Mandate RCA as a non-negotiable step for all significant incidents, ensuring that an incident is not considered "closed" until the root cause is identified and a remediation plan is in place. As judge Maggie Morganti noted, "none of us have any business closing an incident until the RCA is done."
- Drive Detection Engineering: Use RCA findings to iteratively improve Intrusion Detection System (IDS) rules, SIEM alerts, and Endpoint Detection and Response (EDR) configurations specific to OT environments. This proactive tuning helps reduce false positives and increases the efficacy of future detections.
- Foster Cross-Functional Collaboration: RCA often reveals issues spanning IT, OT operations, engineering, and even physical security. Defenders should actively engage these stakeholders, sharing findings and collaborating on systemic fixes to prevent recurrence.
Secondly, Thomas Vason's Advanced Persistent Drinker (APD) metric, while humorous, provides a powerful lesson in contextual intelligence and the integration of physical and cyber security. OT defenders often operate in environments where physical access directly impacts cyber risk. This metric suggests that defenders should:
- Think Beyond Digital Logs: Consider all available data sources, including environmental observations, physical security reports, and even seemingly trivial details, as potential intelligence for threat analysis.
- Integrate Physical and Cyber Security Teams: Establish strong communication channels and joint processes between physical security and OT cyber security teams. Information from physical incidents (like forced entry or unusual activities) can provide critical context for digital investigations, and vice-versa.
- Develop Creative, Site-Specific Metrics: For unique or remote OT sites, standard metrics might not apply. Defenders should empower local teams to identify and track relevant indicators, even if unconventional, that provide actionable insights into site-specific threats and vulnerabilities.
- Improve Incident Response Coordination: Use "dwell time" estimations, as demonstrated by the APD metric, to evaluate and improve coordination with external entities like local law enforcement, ensuring that response times are adequate to interdict threats.
Finally, Vason's Critical Vulnerability Closure Rate metric offers a straightforward, impactful approach to vulnerability management in OT. Defenders should:
- Prioritize Critical Vulnerabilities: Focus remediation efforts on vulnerabilities that pose the highest risk to safety, operational continuity, or environmental impact, rather than getting bogged down by a large volume of lower-severity issues.
- Establish Clear Remediation Targets: Set ambitious but achievable targets for closing critical vulnerabilities within defined timeframes.
- Communicate Risk Effectively: This metric provides a clear, quantifiable way to communicate progress in reducing critical risk to executive leadership, justifying necessary resources and demonstrating tangible security improvements.
- Measure Remediation, Not Just Discovery: It's not enough to simply identify vulnerabilities; the true measure of a vulnerability management program is its ability to effectively remediate them. This metric shifts the focus to the "closure" aspect.
Collectively, these metrics encourage OT defenders to adopt a holistic, pragmatic, and outcome-oriented approach. The emphasis moves from simply collecting data to deriving actionable insights that drive continuous improvement, enhance resilience, and effectively manage the unique risks inherent in operational technology environments.
Key Takeaways
- Metrics Must Drive Action: Effective OT security metrics should not just report status but actively inform decision-making, direct resource allocation, and drive tangible improvements in security posture.
- Prioritize Root Cause Analysis: Focusing on the Incident Root Cause Analysis (RCA) Rate is crucial for breaking cycles of repeated incidents, improving forensic capabilities, and refining detection and response playbooks in OT environments.
- Embrace Contextual Intelligence: Unconventional metrics, like the Advanced Persistent Drinker (APD) metric, demonstrate the value of integrating diverse data sources—including physical observations—to gain actionable insights into unique, site-specific threats.
- Simplicity Aids Adoption: Metrics like the Critical Vulnerability Closure Rate highlight that straightforward, easily understood measures of remediation effectiveness are vital for communicating progress to both technical teams and executive stakeholders.
- Focus on Business Impact: Beyond technical metrics, prioritizing "dollars and safety" ensures that security efforts are aligned with core business objectives and resonate with leadership, demonstrating the value of security investments.
- Foster Collaboration with KPIs: Sharing performance indicators like the RCA rate with the entire team encourages collaboration, empowers analysts to become champions of process improvement, and ensures that everyone is invested in improving the overall security posture.
About the Speaker(s)
The "My Favorite Metric" gameshow was hosted by Ron Fabela, a prominent figure in the ICS/OT security community, known for his insightful contributions and engaging presentations.
The contestants, who presented their favorite metrics, included:
- Az Kahun: Pitched the Incident Root Cause Analysis (RCA) Rate, emphasizing its role in reducing repeated incidents and improving overall security posture.
- David Ong: From Atilla Cybertech in Singapore, presented a metric that, while not fully detailed in the transcript, aimed to measure "APD threat or stat."
- Thomas Vason: Presented two distinct metrics: the highly contextual Advanced Persistent Drinker (APD) metric for physical site break-ins and the more traditional Critical Vulnerability Closure Rate for addressing critical security flaws.
- Vivek Ponada: Advocated for metrics that focus on "dollars and safety," aligning security measurement with core business impacts, though his full metric was not detailed in the transcript.
These individuals represent the diverse expertise and innovative thinking within the OT security domain, contributing to a richer understanding of how to effectively measure and improve security in critical infrastructure.
Reviews
Dr. Zero (Offensive Security Researcher) — STRONG ACCEPT
This session, presented in a novel 'gameshow' format, provided a much-needed, no-nonsense discussion on actionable metrics for Operational Technology (OT) security. It cut through the usual fluff to present practical, real-world measures like Incident Root Cause Analysis (RCA) Rate and the unexpectedly brilliant 'Advanced Persistent Drinker' (APD) metric. The session delivered genuine insights into how to quantify and communicate OT risk and improvement, making it highly valuable for practitioners grappling with the unique challenges of industrial control systems.
Heather Calloway (CISO) — STRONG ACCEPT
The "My Favorite Metric" gameshow at S4 delivered a highly practical and engaging discussion on critical OT security metrics. It effectively challenged the audience to move beyond superficial reporting, championing metrics like Incident Root Cause Analysis Rate, an unconventional Advanced Persistent Drinker metric for physical security, and Critical Vulnerability Closure Rate. The session underscored the vital need for measurements that drive accountability, inform executive decisions, and translate directly into tangible operational improvements and risk reduction in complex industrial environments.